Restaurant Employee Turnover Statistics (2026): The Numbers, With Sources
Restaurant employee turnover statistics, 2026: quit rates, hourly and manager turnover, median tenure and the cost to replace a worker. Every number sourced.
Last updated November 6, 2026. Every number below comes from a linked source, listed with each section.
I have decades of restaurant knowledge, and turnover is the cost nobody puts on the P&L line where it belongs. It hides in overtime, in training hours, in the manager who stays late because the new closer did not know where the temp log goes.
This page pulls the most useful restaurant turnover numbers into one place: how often people quit, how long they stay, what it costs to replace them, and why they leave. Government data first, then industry research. Where I did math myself, I say so and show it.
Key restaurant turnover statistics
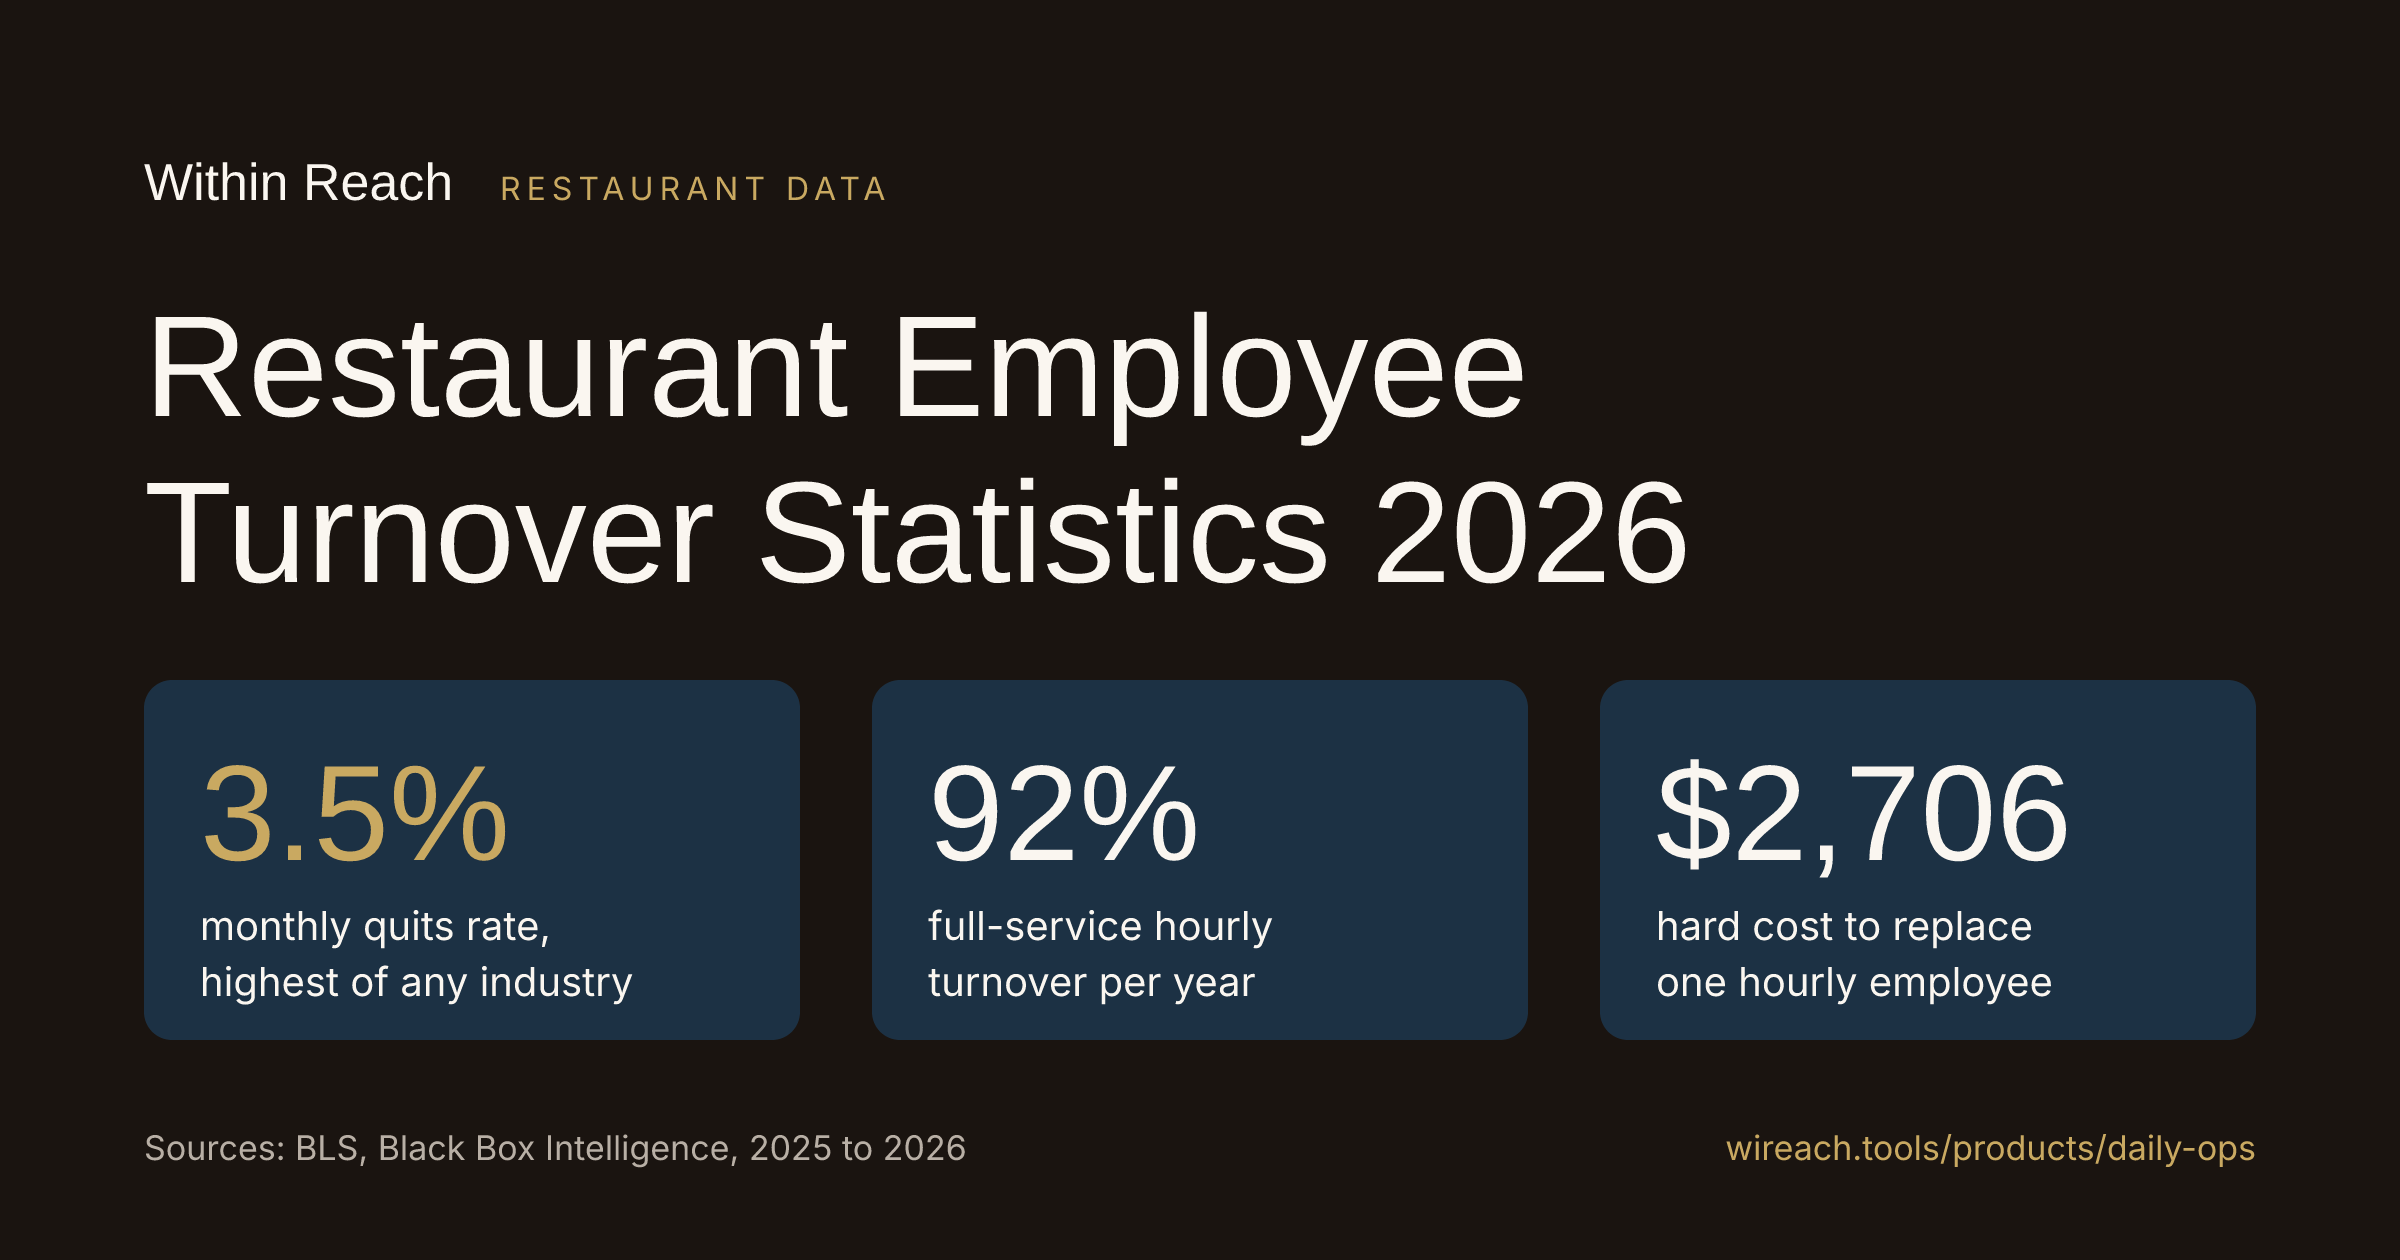
- Restaurants and hotels (accommodation and food services) post a 3.5% monthly quits rate, the highest of any US industry (BLS, August 2026).
- That is almost double the 1.9% quits rate across all industries.
- Full-service hourly turnover runs about 92% a year. Limited-service hourly turnover is 110% (Black Box Intelligence, 2025).
- Replacing one hourly employee costs about $2,706 in hard dollars. A general manager costs $17,651 (Black Box Intelligence).
- Median tenure in food preparation and serving jobs is 2.2 years, versus 4.1 years for all workers (BLS, January 2026).
- 43% of QSR hires leave within 90 days (Fountain, 2025).
- 45% of restaurant employees cite poor leadership as a reason for leaving (7shifts).
Turnover is not only a hiring problem. It is an onboarding problem. A new hire who never gets a clear opening and closing routine is the one who leaves in week three. If you want every shift to run the same way no matter who is on, a checklist your crew signs off on in Daily Ops shift checklists is the cheapest fix I know.
How often restaurant workers quit (BLS data)
The Bureau of Labor Statistics tracks quits every month through its Job Openings and Labor Turnover Survey (JOLTS). Restaurants and hotels are grouped as "accommodation and food services."
| Industry | Monthly quits rate, Aug 2026 |
|---|---|
| Accommodation and food services | 3.5% |
| Retail trade | 3.0% |
| Other services | 2.7% |
| All industries | 1.9% |
| Manufacturing | 1.6% |
| Finance and insurance | 1.0% |
Source: BLS, The Economics Daily, October 2026
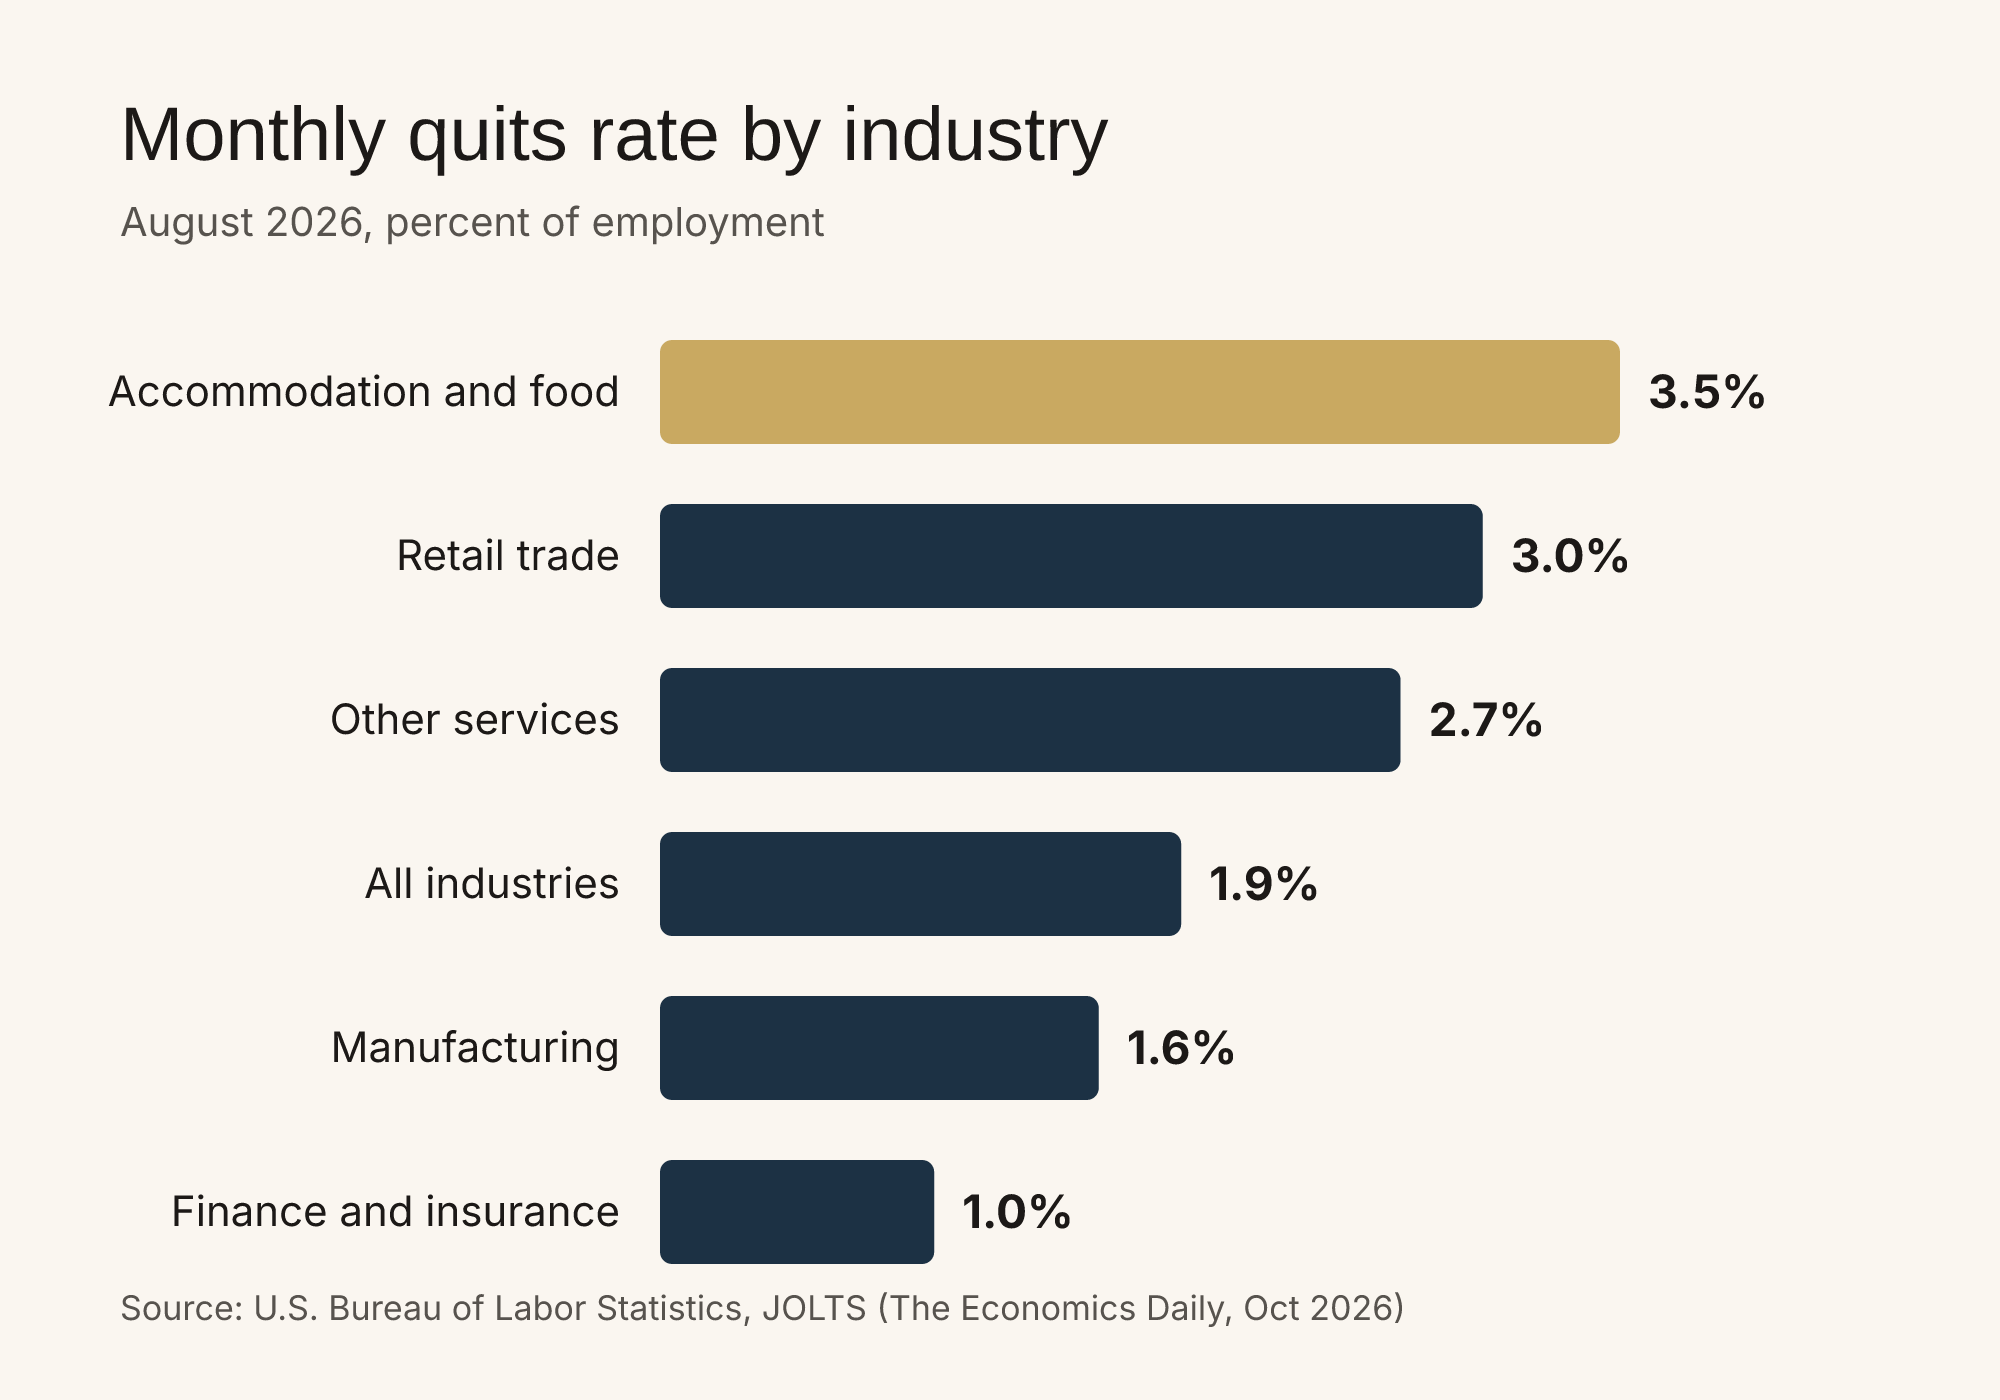
Restaurants and hotels lose a larger share of their workforce to quits each month than any other industry.
- The accommodation and food services quits rate was 3.9% in August 2025, so it has eased a little in a year (BLS).
- About 776,000 people quit jobs in accommodation and food services in September 2026 alone, not seasonally adjusted (FRED, series JTU7200QUL).
- The industry's monthly hires rate was 6.1% and its total separations rate was 6.2% in September 2026 (preliminary), compared with 3.7% separations for all private employers (BLS JOLTS).
- Accommodation and food services had 659,000 open jobs in September 2026 (preliminary), a job openings rate of 4.4% (BLS JOLTS).
Restaurant turnover rates by segment and role
BLS rates are monthly and include hotels. For restaurant-only annual turnover, the best regular source is Black Box Intelligence, which collects HR and payroll data from large restaurant brands.
| Segment | Hourly turnover | Management turnover |
|---|---|---|
| Limited service | 110% (2025 Q3, rolling 12) | about 44% to 47% (2024 to 2025) |
| Full service | about 92% (2025 Q1 to Q3) | 35% (2025 Q3) |
Source: Black Box Intelligence, State of the Restaurant Workforce
- Limited-service hourly turnover has come down from 133% in 2019. Full-service has come down from 101% in 2019.
- Full-service management turnover eased from 41% in 2024 Q3 to 35% in 2025 Q3, still above pre-pandemic lows.
- Fountain's 2025 QSR snapshot reports that 43% of hires leave within 90 days, and that the median time to hire a team member is 6 days (8 days for a manager) (Fountain).
How long restaurant employees stay
The BLS employee tenure survey runs every two years. The January 2026 numbers:
- Median tenure in food preparation and serving occupations: 2.2 years.
- Median tenure for all wage and salary workers: 4.1 years.
- Leisure and hospitality had the lowest median tenure of any major industry at 2.4 years.
- Workers age 20 to 24 had a median tenure of 1.5 years.
Source: BLS Employee Tenure, September 2026
Payroll data shows something sharper. In a 7shifts study of employees added between August 2021 and August 2022, the average tenure was 110 days, under four months (7shifts). Medians and averages tell different stories here: a core crew stays for years while a revolving set of new hires leaves fast.
What turnover costs a restaurant
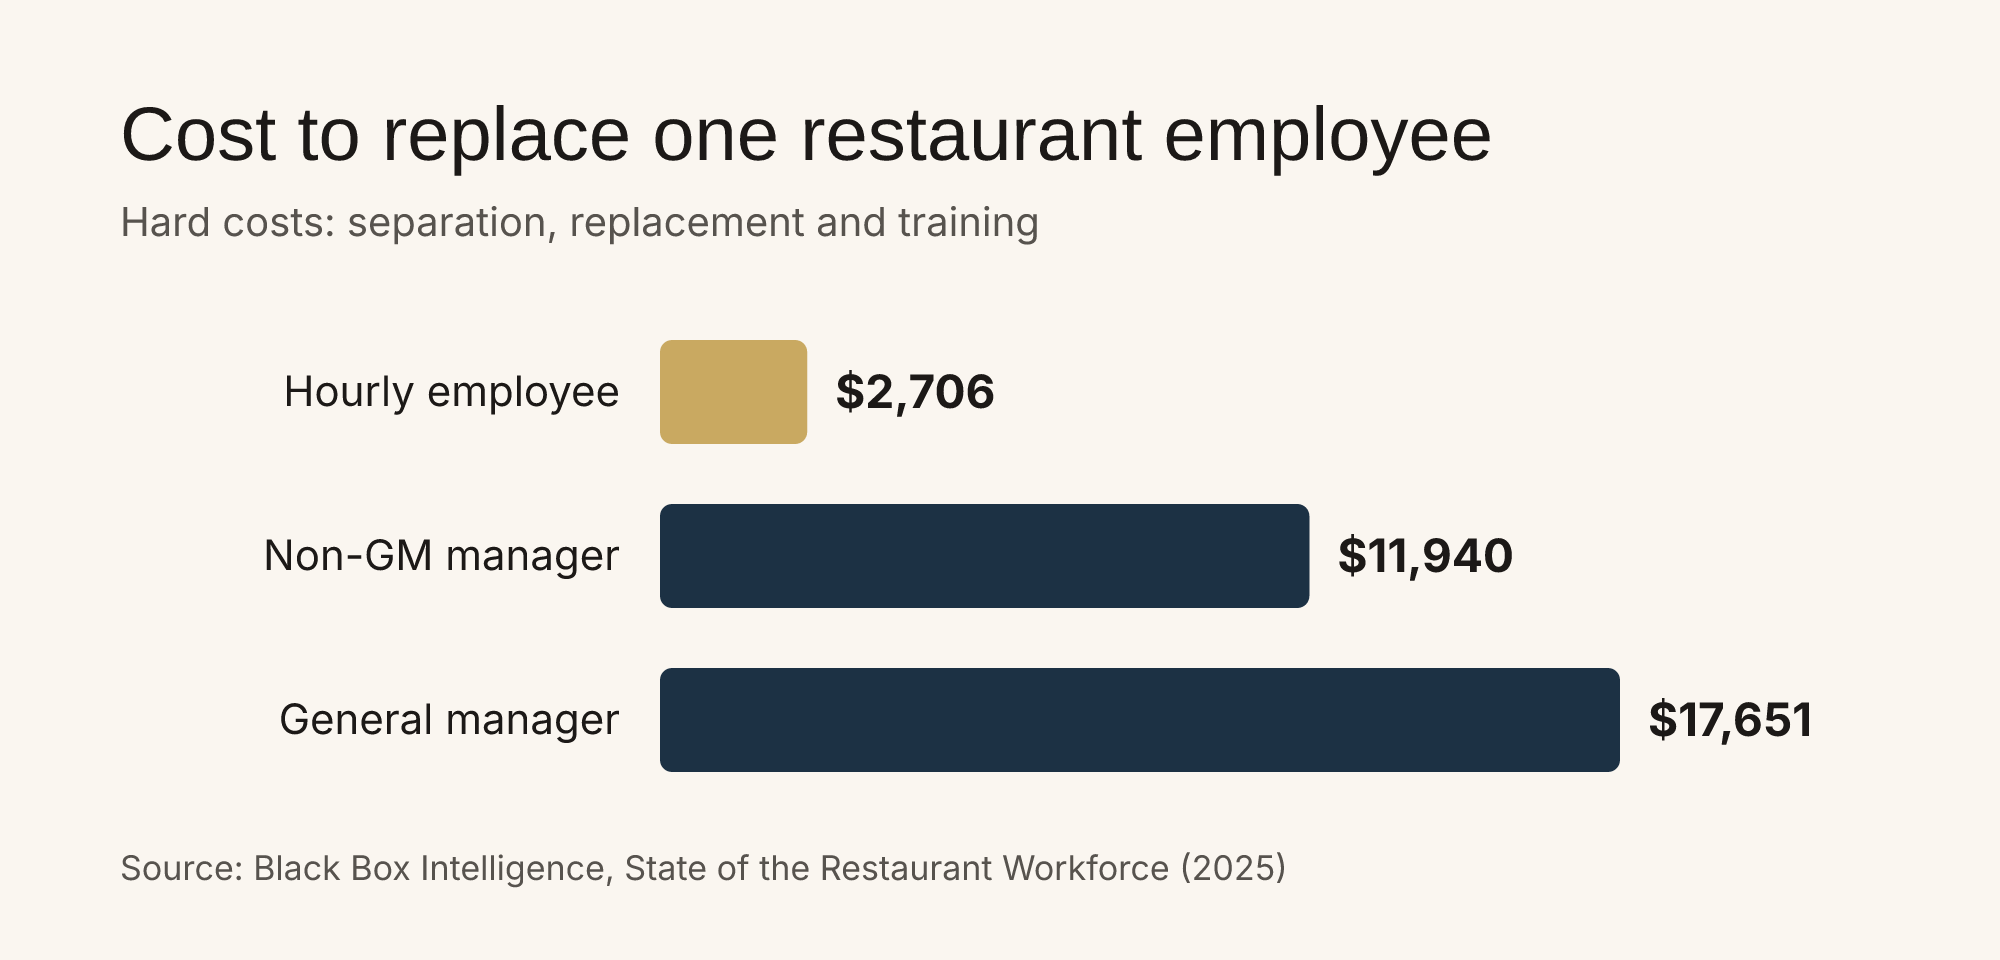
Hard costs only: separation, replacement and training. Lost sales are not included.
- Replacing a restaurant hourly employee: about $2,706 in hard costs.
- Replacing a non-GM manager: about $11,940.
- Replacing a general manager: about $17,651.
- Training is about 35% of the hourly replacement cost, 53% for non-GM managers and 54% for GMs.
Source: Black Box Intelligence
What that looks like for one store (my math): a full-service store with 30 hourly employees at 92% turnover replaces about 28 people a year (30 x 0.92 = 27.6). At $2,706 each, that is roughly $76,000 a year in hard costs before you count a single lost sale.
Your number will be different. Plug in your own recruiting spend, training hours and people lost into the cost of turnover calculator, then compare it with your total payroll in the restaurant labor cost calculator.
Why restaurant employees leave
- 45% of employees cite poor leadership as a reason for leaving, according to 7shifts CEO Jordan Boesch (7shifts workforce report, November 2024).
- 34.6% cite wages as a reason for leaving or planning to leave (7shifts survey).
- Restaurant base wages rose 4% to $14.20 an hour in the same 7shifts workforce report.
- The BLS median annual wage for food preparation and serving occupations was $35,050 in May 2025, against $50,980 for all occupations (BLS Occupational Outlook Handbook).
Pay matters, but leadership shows up first. In my experience that mostly means the basics: a schedule people can plan around, clear expectations on every shift, and a manager who notices good work.
Who works in restaurants
- Restaurant and foodservice employment is projected to reach 15.8 million jobs in 2026, with operators forecast to add more than 100,000 jobs (National Restaurant Association).
- Nearly three quarters of operators plan to hire in 2026 but expect trouble finding experienced managers and chefs (same source).
- Restaurant employees are three times more likely than the total US workforce to be under 25, and 27% are enrolled in school (National Restaurant Association).
- 51% of US adults say their first regular job was in restaurants and foodservice (same source).
- BLS projects about 2.4 million openings a year in food preparation and serving occupations over its 2025 to 2035 projection period (BLS).
A young, part-time, in-school workforce will always turn over more than an office. The goal is not zero turnover. It is making each new hire productive faster and keeping the ones you want.
What operators can do with these numbers
- Measure your own rate. People who left in the last 12 months divided by your average headcount. Compare it with the 92% and 110% benchmarks above.
- Put a dollar figure on it. Use your real training hours, not a guess.
- Fix the first 90 days. With 43% of QSR hires gone by day 90, onboarding is where the money is. Written opening, closing and mid-shift routines that a new hire can follow on day one cut the questions and the mistakes. That is what Daily Ops checklists for every shift are built for: opening, closing and mid-shift lists with temp and cash logging, and a summary email at close.
- Track no-shows early. Call-offs often come before quits. The no-show cost calculator shows what they are costing you now.
Methodology and sources
Numbers come from the Bureau of Labor Statistics (JOLTS, Employee Tenure, Occupational Outlook Handbook), FRED, the National Restaurant Association, Black Box Intelligence, 7shifts and Fountain. BLS figures for the latest month are preliminary and can be revised. Black Box turnover and cost figures are based on participating restaurant companies and may not match an independent single store. Each number is checked against its source on a regular schedule, and this page is updated when newer data is published.
Frequently asked questions
What is the average employee turnover rate in restaurants?
Black Box Intelligence puts hourly turnover at about 92% in full-service restaurants (2025 Q1 to Q3) and 110% in limited-service restaurants (2025 Q3, rolling 12 months). At the industry level, that means limited-service restaurants replace more hourly workers in a year than they employ at any one time.
What is the restaurant industry quit rate?
The Bureau of Labor Statistics reported a 3.5% monthly quits rate for accommodation and food services in August 2026, the highest of any industry and almost double the 1.9% rate across all industries.
How much does it cost to replace a restaurant employee?
Black Box Intelligence estimates hard costs of about $2,706 to replace an hourly employee, $11,940 for a non-GM manager, and $17,651 for a general manager. Those figures cover separation, replacement and training only. Lost sales from a short-handed shift are not included.
How long do restaurant employees stay?
BLS data from January 2026 shows median tenure of 2.2 years in food preparation and serving occupations, compared with 4.1 years for all wage and salary workers. Many hires leave much sooner: Fountain reports 43% of QSR hires leave within 90 days.
Why do restaurant employees quit?
In 7shifts research, 45% of employees cited poor leadership as a reason for leaving, and 34.6% cited wages. Lack of recognition from managers was also among the top three reasons.
How often is this page updated?
The sources behind every number on this page are re-checked on a schedule. When a source publishes newer data, the page is updated and the date at the top changes.