Restaurant Food Cost Statistics (2026): The Numbers, With Sources
Restaurant food cost statistics: menu vs grocery inflation, wholesale prices, food cost % benchmarks and what operators are doing. Every number sourced.
Last updated November 16, 2026. Every number below comes from a linked source, listed with each section.
Food cost is the number I check before I check anything else. Labor you can see on the schedule. Food cost hides in a case of chicken that got ordered twice, a walk-in nobody counted, and a fryer oil price that moved and nobody told the kitchen.
This page puts the food cost numbers worth knowing in one spot: what prices are doing, what a normal food cost percentage looks like, and how operators are handling it. Government data first, then the National Restaurant Association, then industry surveys. Where I did the math myself, I say so.
Key restaurant food cost statistics
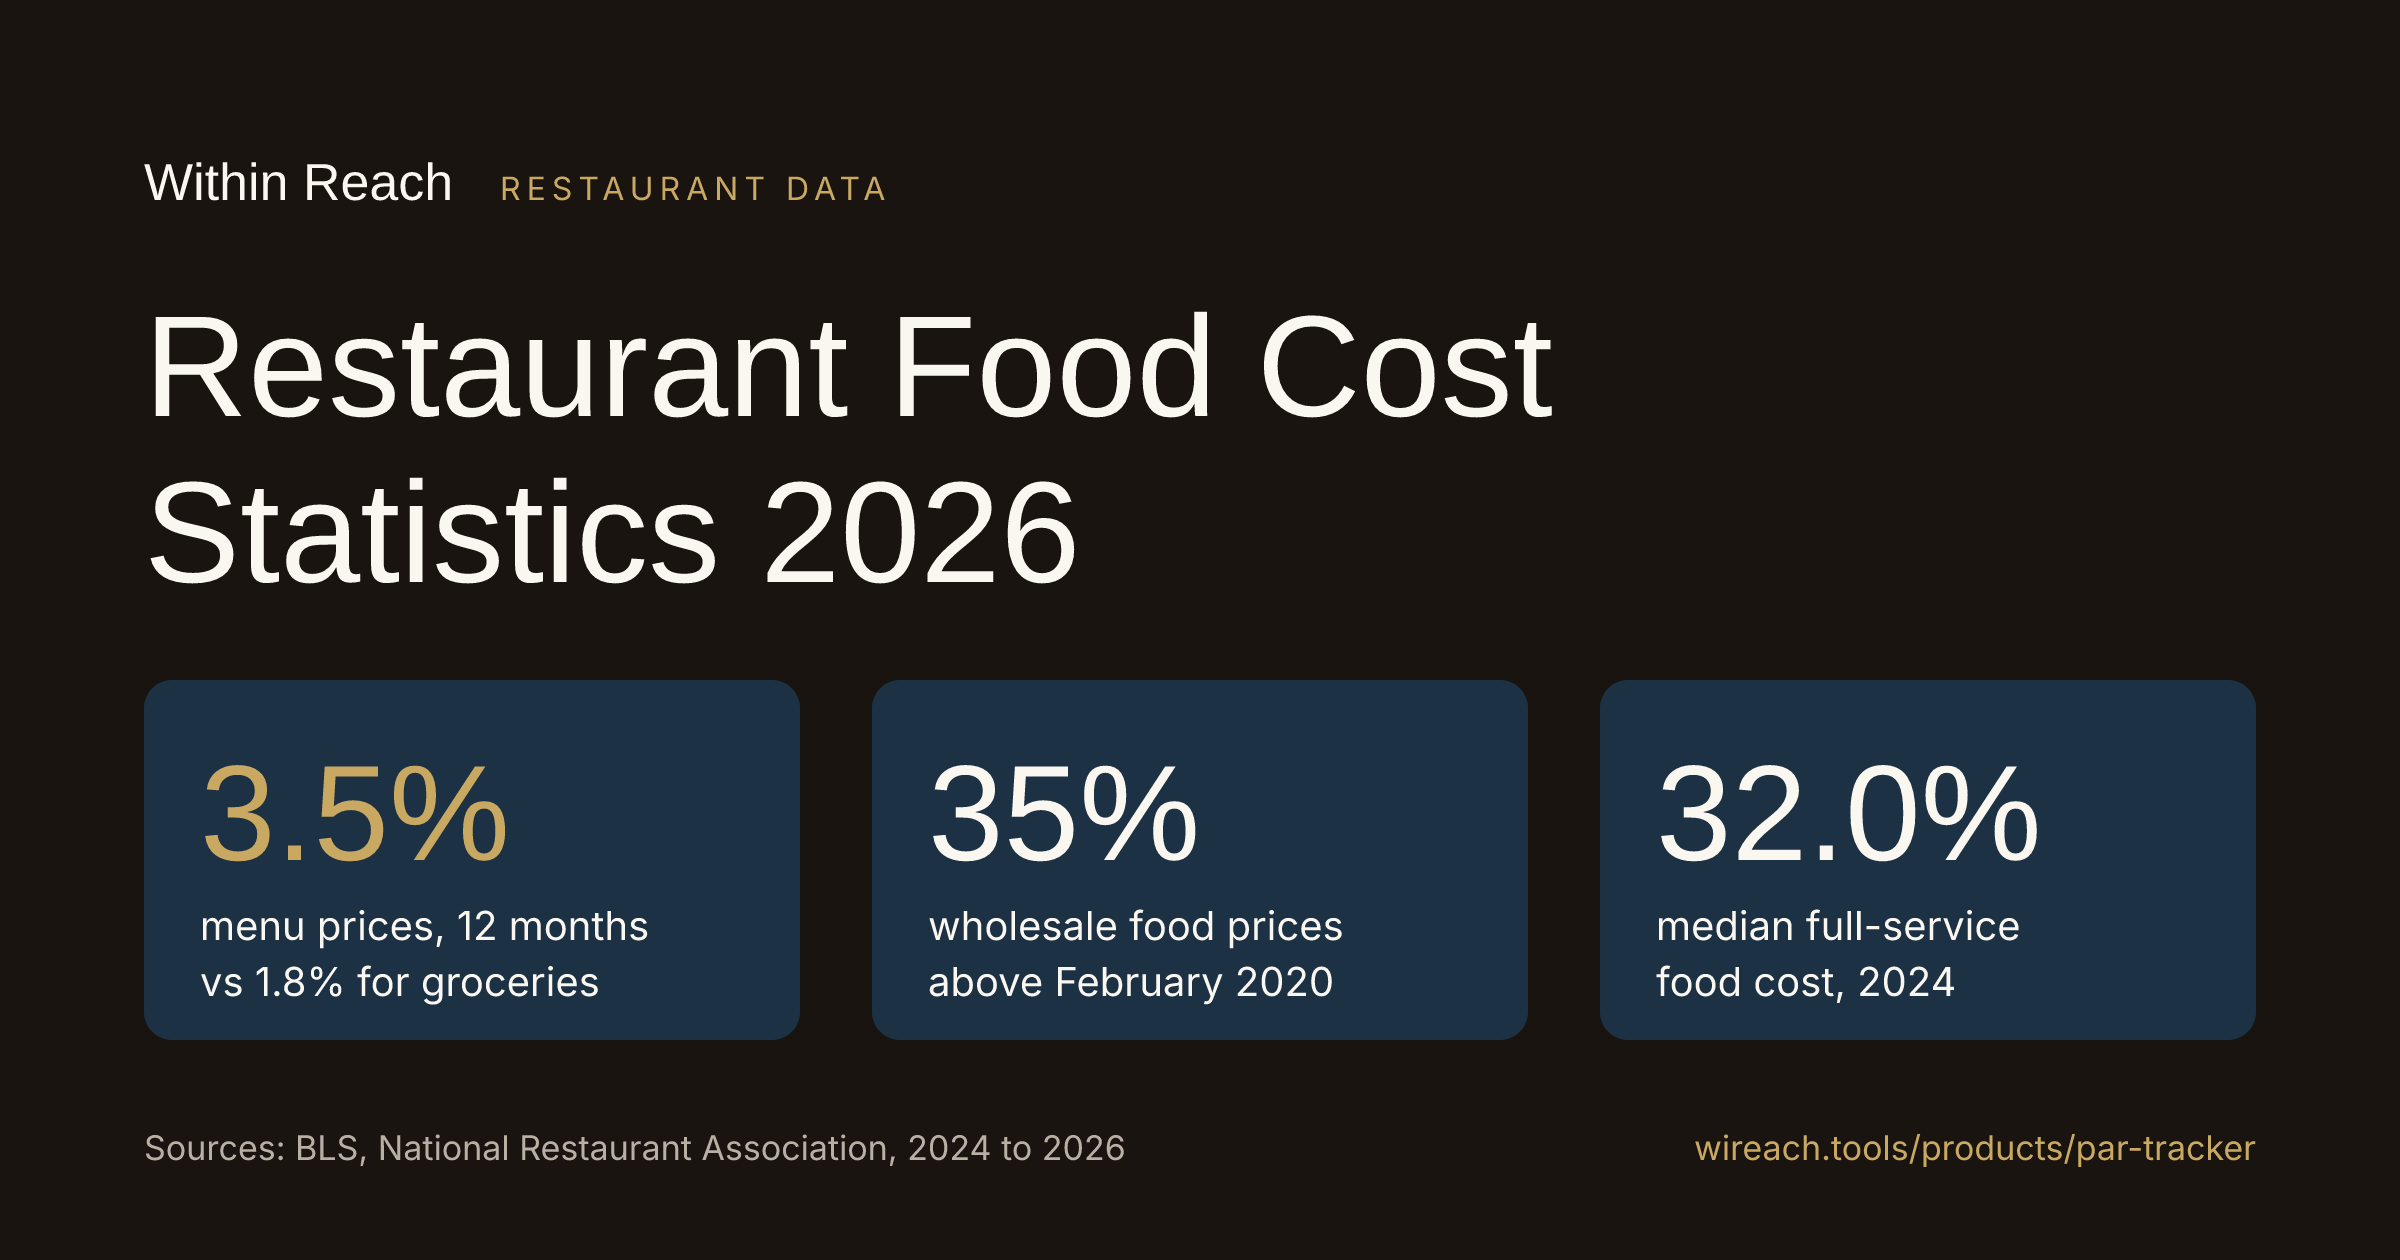
- Restaurant menu prices (food away from home) rose 3.5% from September 2025 to September 2026. Grocery prices rose 1.8% (BLS).
- Wholesale food prices are 35% above where they were in February 2020 (National Restaurant Association, October 2026).
- Even so, average wholesale prices were 0.5% below a year earlier in October 2026 (National Restaurant Association).
- Median food and beverage cost was 32.0% of sales in full service and 32.4% in limited service in 2024 (National Restaurant Association).
- 87% of operators reported food cost increases in the first half of 2026 (Restaurant365).
- 95% of full-service and 94% of limited-service operators call elevated food costs their primary concern (National Restaurant Association).
- USDA forecasts retail beef prices up 8.7% in 2026 and egg prices down 29.3% (USDA ERS).
- Food away from home was 56.3% of all US food spending in 2025 (USDA ERS).
The big numbers are set somewhere you do not control. What you do control is how much of what you buy ends up in the trash or the wrong order. That starts with knowing what is on the shelf before the truck shows up, which is the whole job of par counts at the walk-in with Par Level Tracker.
Restaurant menu prices vs grocery prices (BLS data)
The Bureau of Labor Statistics Consumer Price Index tracks what guests pay. "Food away from home" is restaurants and other foodservice.
| Category | 12-month change, Sep 2026 |
|---|---|
| Full service meals and snacks | 3.8% |
| Food away from home (all) | 3.5% |
| Limited service meals and snacks | 3.2% |
| All items | 3.7% |
| Food at home (grocery) | 1.8% |
Source: BLS CPI, September 2026 release
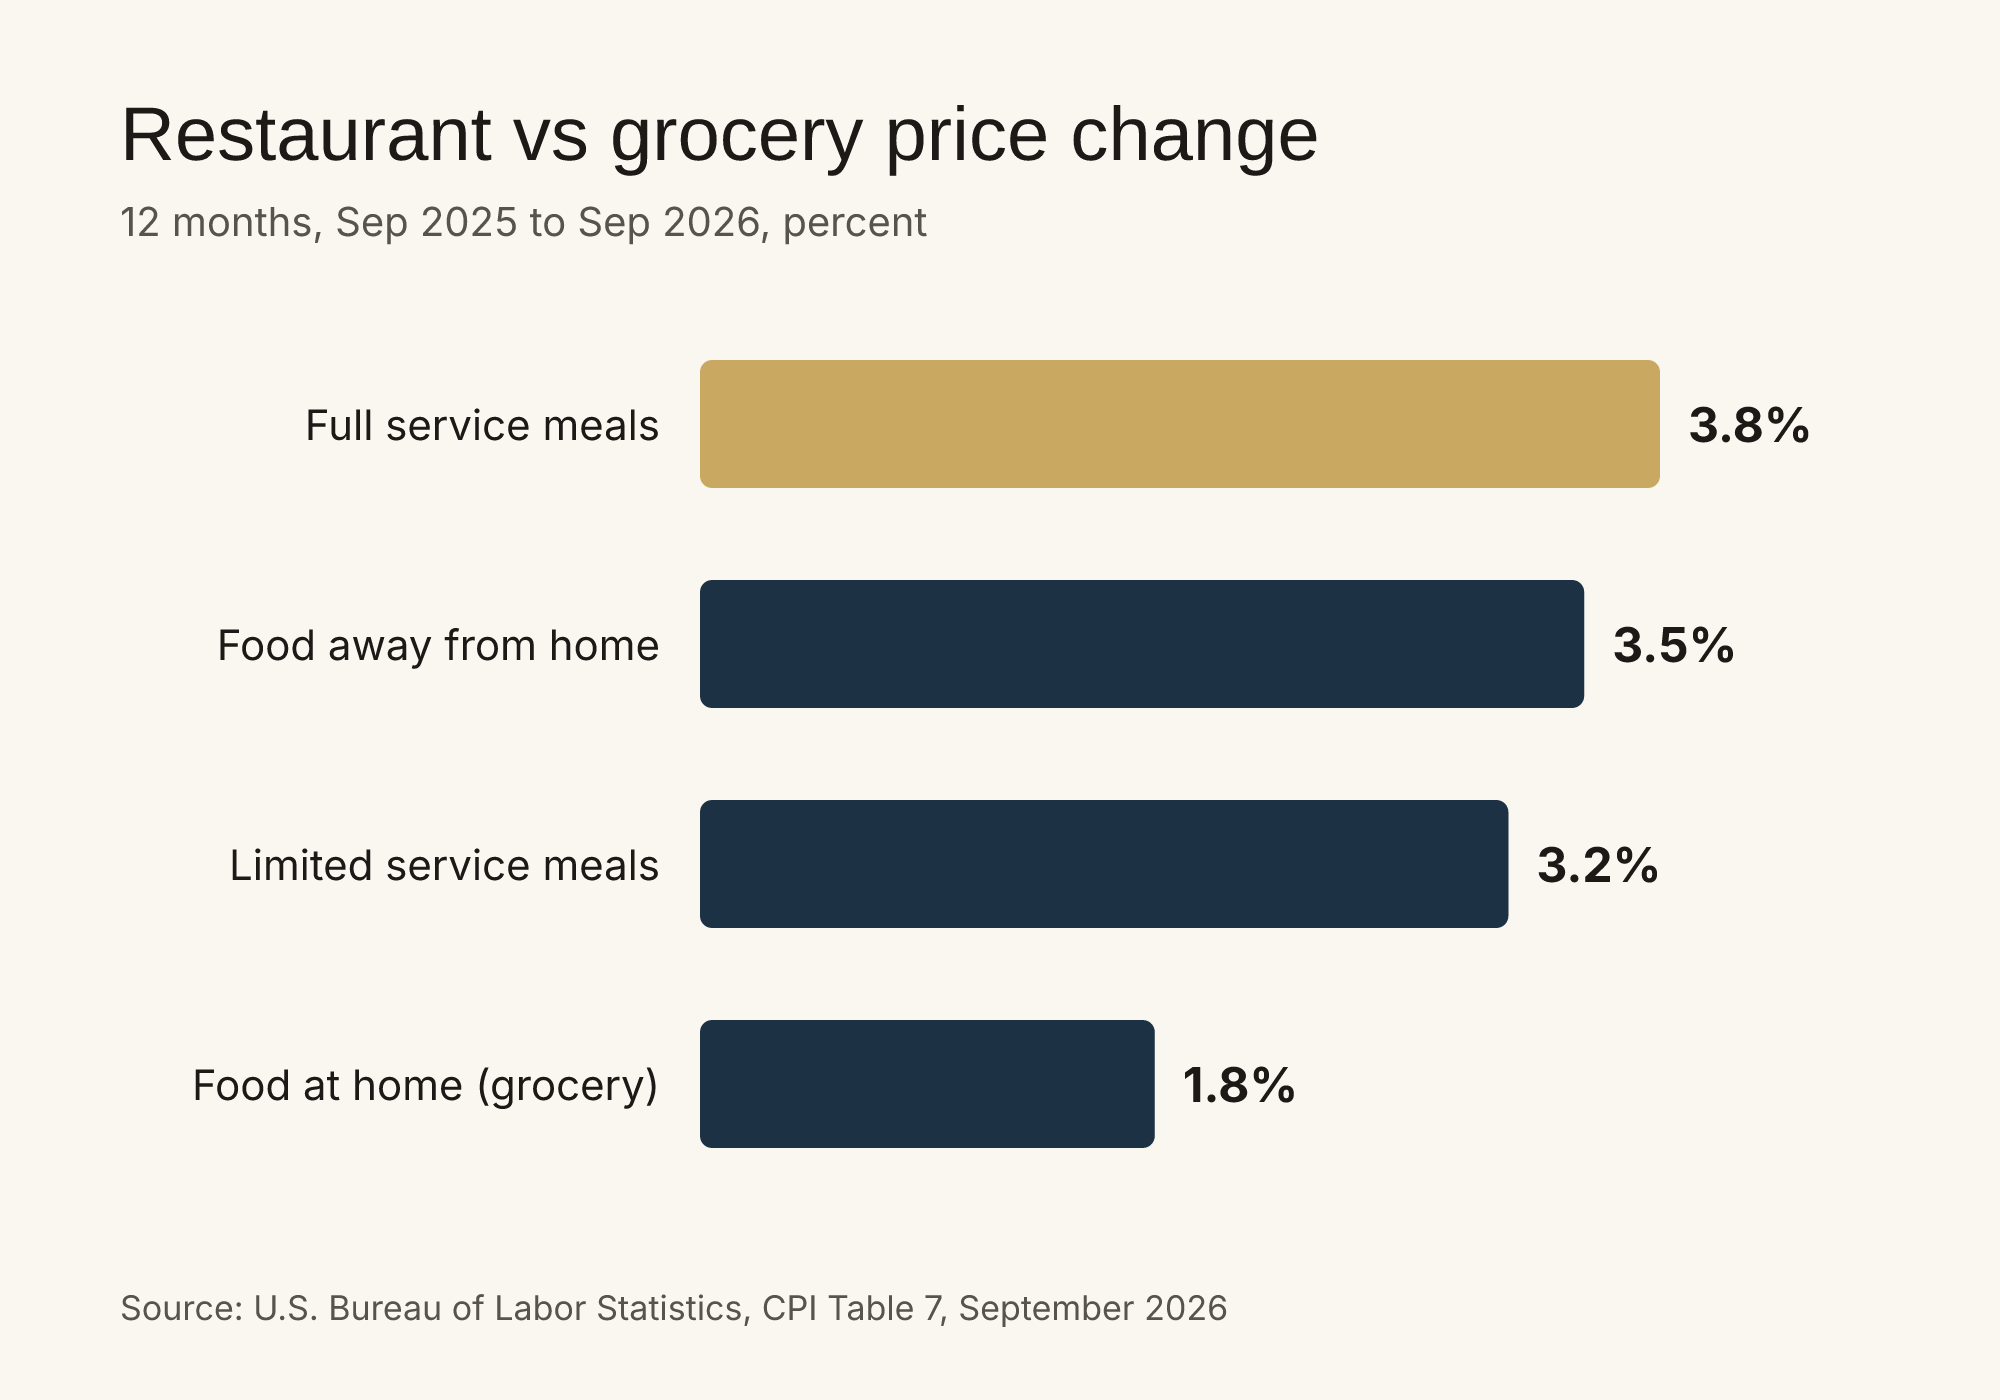
Menu prices are climbing almost twice as fast as grocery prices.
- Restaurant prices rose 1.7 points faster than grocery prices over those 12 months, almost double the rate (my math: 3.5 minus 1.8).
- USDA forecasts food-away-from-home prices up 3.5% in 2026 (forecast interval 3.4 to 3.7 percent) and 2.8% in 2027 (USDA ERS Food Price Outlook).
- Over the 20 years from 2006 to 2025, restaurant prices rose 3.5% a year on average, against 2.6% for grocery prices (same source).
That gap matters on the floor. When a guest can feed the family at home for less, every plate you send has to be right. Raising prices covers some of it. Waste and over-ordering eat the rest.
Wholesale food prices: what you pay the distributor
Menu prices are what guests pay. The Producer Price Index is closer to what shows up on your invoice.
- The Producer Price Index for All Foods jumped 1.2% from September to October 2026 (preliminary).
- It was 0.5% below its October 2025 level.
- It stood 35% above its February 2020 reading.
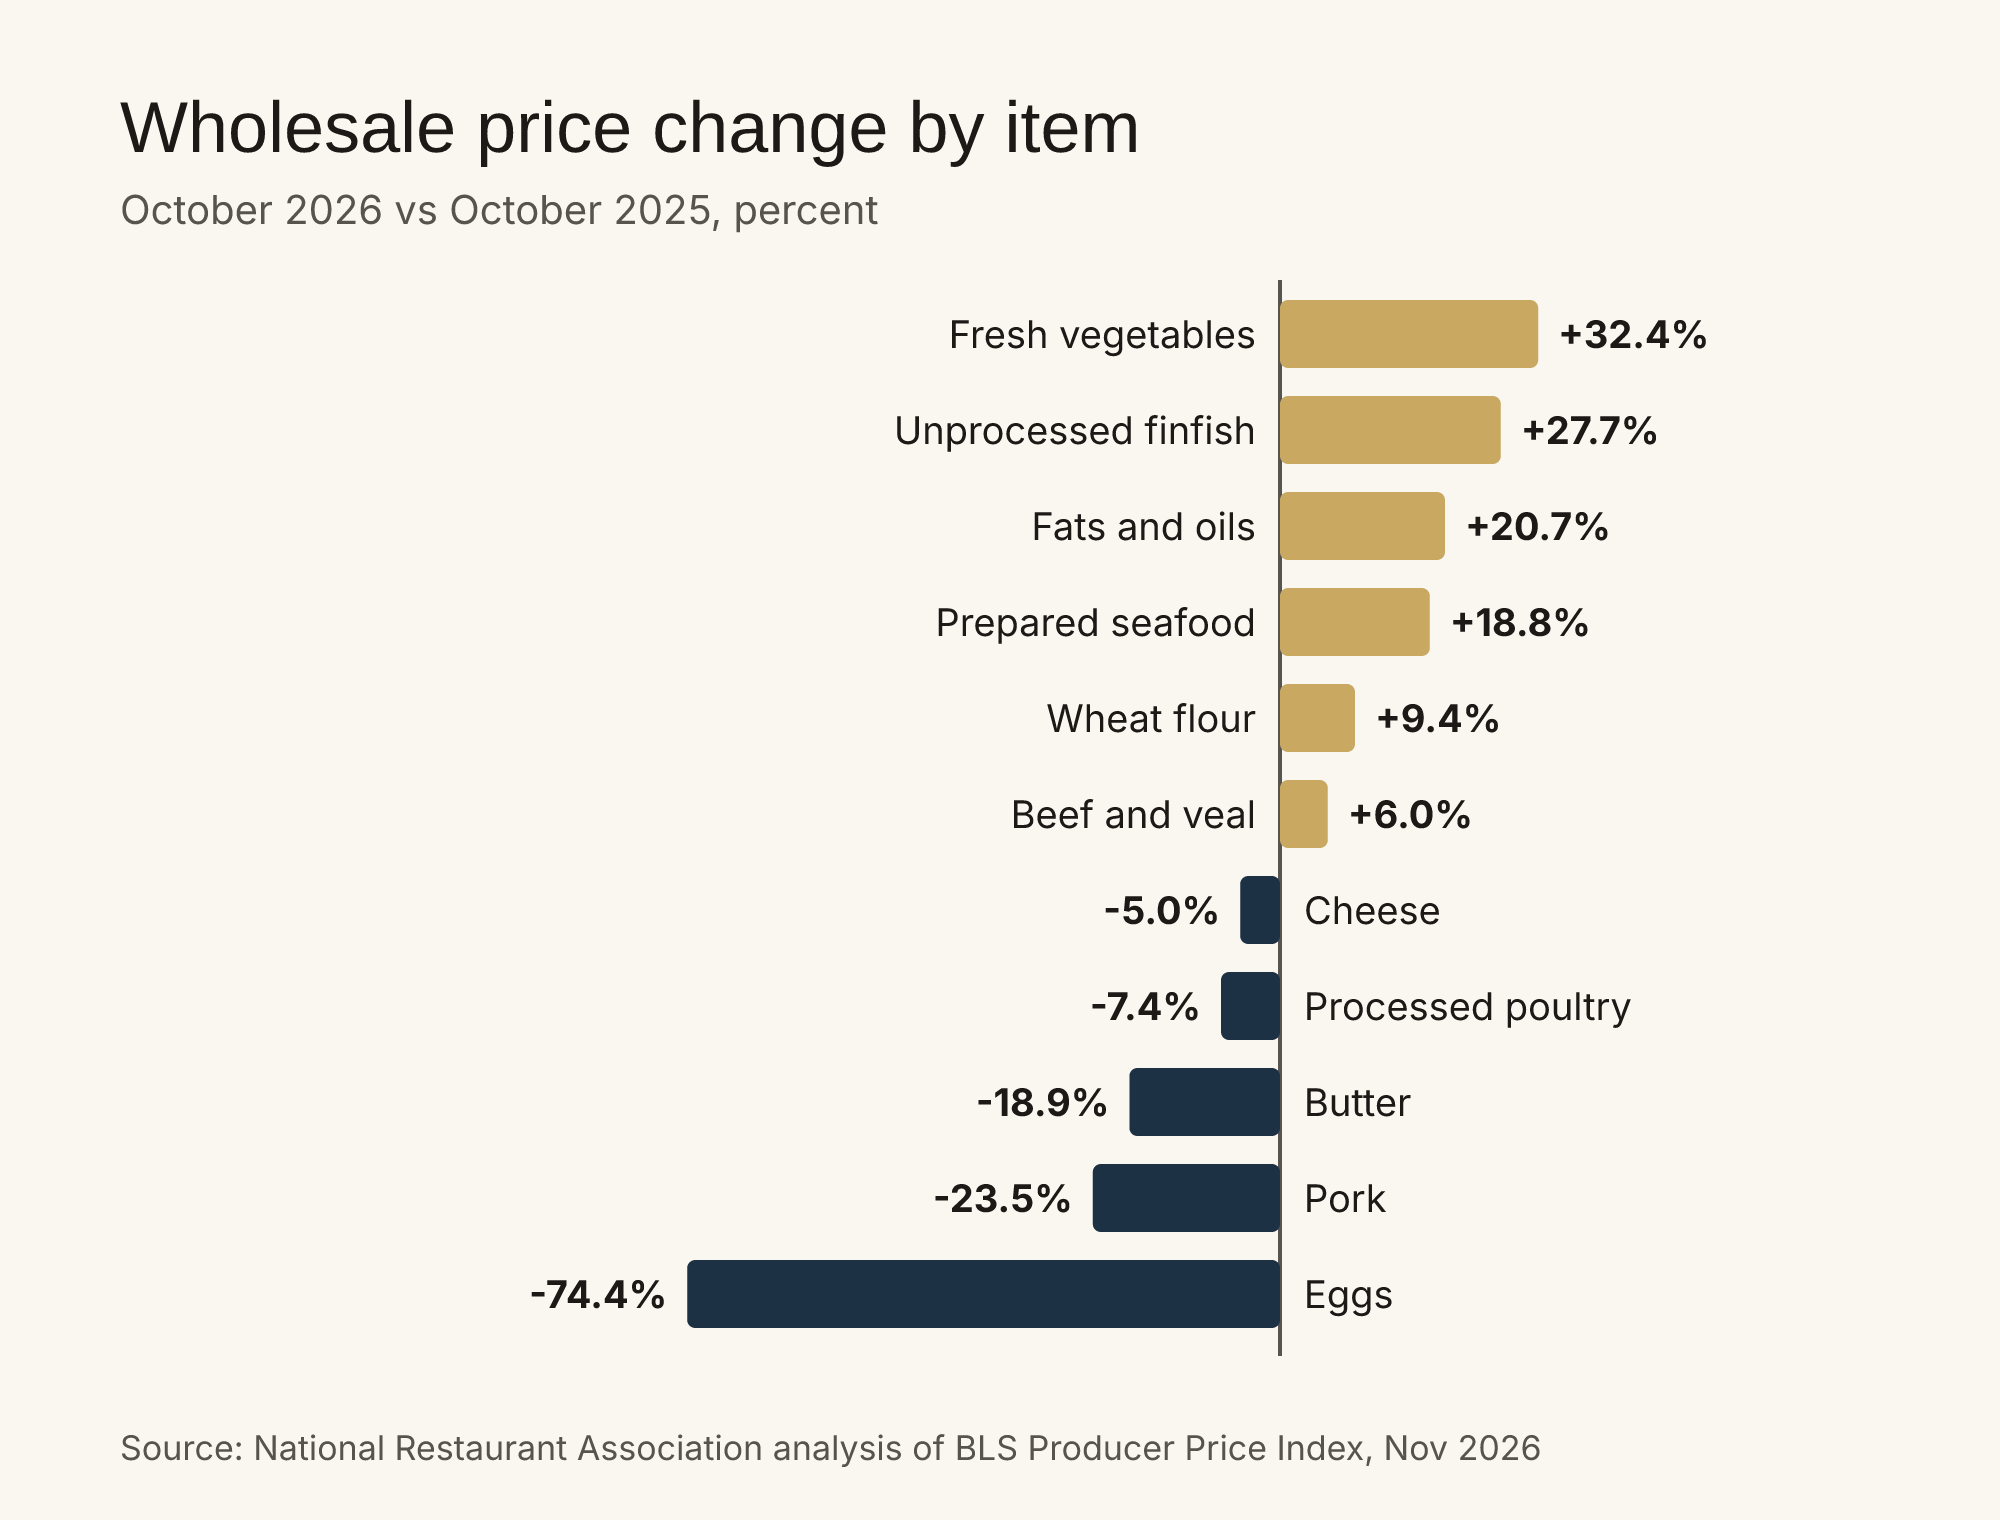
The average is down a little. Your menu is not the average.
Up from a year ago: fresh vegetables 32.4%, unprocessed finfish 27.7%, fats and oils 20.7%, prepared seafood 18.8%, wheat flour 9.4%, beef and veal 6.0%.
Down from a year ago: eggs 74.4%, pork 23.5%, butter 18.9%, processed poultry 7.4%, cheese 5.0%.
Source: National Restaurant Association, Food Costs, November 2026
If you fry, the 20.7% on fats and oils hits you every single day. If you run a breakfast menu, eggs gave you a break this year. Know which side of this list your menu lives on.
Food cost percentage benchmarks
| Segment | Median food and beverage cost, 2024 | Earlier editions |
|---|---|---|
| Full service | 32.0% of sales | 34% average |
| Limited service | 32.4% of sales | about 33% average |
Source: National Restaurant Association, Restaurant Operations Data Abstract, data from more than 900 operators.
- A range of 30% to 35% is commonly used as a rule of thumb (Toast). One number does not fit every concept.
- Both segments came in lower than in earlier editions of the report. Operators held the line.
What one point is worth (my math): a store doing $1.2 million a year at the 32.0% full-service median spends about $384,000 on food and beverage. Every single point of food cost is $12,000 a year. That is why a point matters.
To see where your own points are going, run your theoretical vs actual numbers through the food cost variance calculator.
What operators are seeing and doing
From the Restaurant365 2026 mid-year report, more than 420 operators representing nearly 10,000 locations:
- 87% reported food cost increases in the first half of 2026.
- Of those, 51% saw an increase of 1 to 5%, 37% saw 6 to 14%, and 11% saw more than 15%.
- 78% expect food costs to keep rising through the end of 2026, down from 88% at the start of the year.
- Only 52% are raising menu prices to offset food costs now, down from 66% at the start of 2026 and 60% in mid-2024. That is the lowest in three years.
- Food costs were 29.7% of top-challenge answers, second to recruiting and retaining staff at 32.9%.
From the National Restaurant Association 2026 State of the Industry findings:
- About 82% of operators had higher food costs in 2025 than the year before. Only 6% saw a decline.
- 68% said tariffs contributed to higher food and beverage expenses.
- Full service: 90% raised prices, 63% found other suppliers, 60% cut menu items.
- Limited service: 85% raised prices, 51% found new suppliers, 43% cut menu items.
Read those last two lines together. Price increases are running out of road, so the next point of food cost has to come out of the kitchen: tighter menus, better ordering, less waste.
Where restaurant food dollars go
- Americans spent $2.51 trillion on food in 2025. $1.41 trillion of it was food away from home.
- Food away from home was 56.3% of total food spending in 2025.
Source: USDA ERS, Food Expenditure Series, June 2026
USDA's 2026 retail forecasts for the items most kitchens buy (USDA ERS):
- Beef and veal up 8.7%. Wholesale beef up 8.8%. That is about 2.5 times the menu price forecast (my math: 8.7 divided by 3.5).
- Fresh vegetables up 5.8%.
- Eggs down 29.3%.
Retail CPI to September 2026 shows the same split: beef and veal up 3.5%, fresh vegetables up 2.8%, poultry up 1.1%, dairy down 0.7%, eggs down 20.6% (BLS).
What operators can do with these numbers
- Know your real food cost. Beginning inventory plus purchases minus ending inventory, divided by food sales. Compare it with the 32.0% and 32.4% medians above, not a number somebody told you in 2015.
- Price your menu off your invoices. Wholesale moved 32.4% on one item and minus 74.4% on another. Re-cost the plates built on the movers first.
- Count to par before every order. Most over-ordering is a guess made in a hurry. A crew member counting at the walk-in by PIN, with the shortfall list emailed to you when they submit, takes the guess out. That is what Par Level Tracker shortfall alerts do: you know what is short before the order goes in.
- Chase the variance weekly. One point is $12,000 a year on a $1.2 million store. Find it while it is small.
Methodology and sources
Numbers come from the Bureau of Labor Statistics (CPI, September 2026), USDA Economic Research Service (Food Price Outlook, October 2026, and Food Expenditure Series, June 2026), the National Restaurant Association (Food Costs indicator, Restaurant Operations Data Abstract, State of the Restaurant Industry), Restaurant365 and Toast. CPI changes are 12-month, not seasonally adjusted. USDA forecasts are annual averages and can change with each monthly outlook. NRA benchmarks are medians from participating operators and may not match a single store. Restaurant365 figures are survey responses, not audited costs. I left out numbers from pages that did not name their own source. Each number is re-checked against its source on a schedule, and this page is updated when newer data is published.
Frequently asked questions
What is a normal food cost percentage for a restaurant?
The National Restaurant Association reports a median food and non-alcohol beverage cost of 32.0% of sales for full-service restaurants and 32.4% for limited-service restaurants in 2024, based on more than 900 operators. A range of 30% to 35% is commonly used as a rule of thumb.
How much have restaurant food costs gone up?
The Producer Price Index for All Foods stood 35% above its February 2020 level in October 2026, according to the National Restaurant Association. In the 2026 Restaurant365 mid-year survey, 87% of operators reported food cost increases in the first half of 2026.
Are wholesale food prices going down in 2026?
On average, slightly. Wholesale food prices in October 2026 were 0.5% below October 2025. But it is item by item: eggs were down 74.4% and pork 23.5%, while fresh vegetables were up 32.4% and fats and oils up 20.7%.
How fast are restaurant menu prices rising?
BLS data shows food away from home prices rose 3.5% from September 2025 to September 2026. Full-service meals rose 3.8% and limited-service meals 3.2%. Grocery prices rose 1.8% over the same 12 months.
What share of food spending goes to restaurants?
USDA ERS reports food away from home accounted for 56.3% of total US food expenditures in 2025, or $1.41 trillion of $2.51 trillion in total food spending.
How often is this page updated?
The sources behind every number on this page are re-checked on a schedule. When a source publishes newer data, the page is updated and the date at the top changes.