Restaurant Food Waste Statistics (2026): The Numbers, With Sources
Restaurant food waste statistics for 2026: tons wasted, where it goes, plate waste vs kitchen waste, and what cutting it pays back. Every number sourced.
Last updated November 3, 2026. Every number below comes from a linked source, listed with each section.
I have decades of restaurant knowledge. Waste is the one cost I can see with my own eyes every night, and it is still the one most stores never count. It goes in the bin at close, the bin goes out back, and by morning nobody can tell you what it cost.
This page puts the restaurant food waste numbers in one place: how much, where it comes from, where it ends up, and what cutting it pays back. Government and nonprofit data first, then vendor numbers, labeled as vendor numbers. Where I did math myself, I say so and show it.
Key restaurant food waste statistics
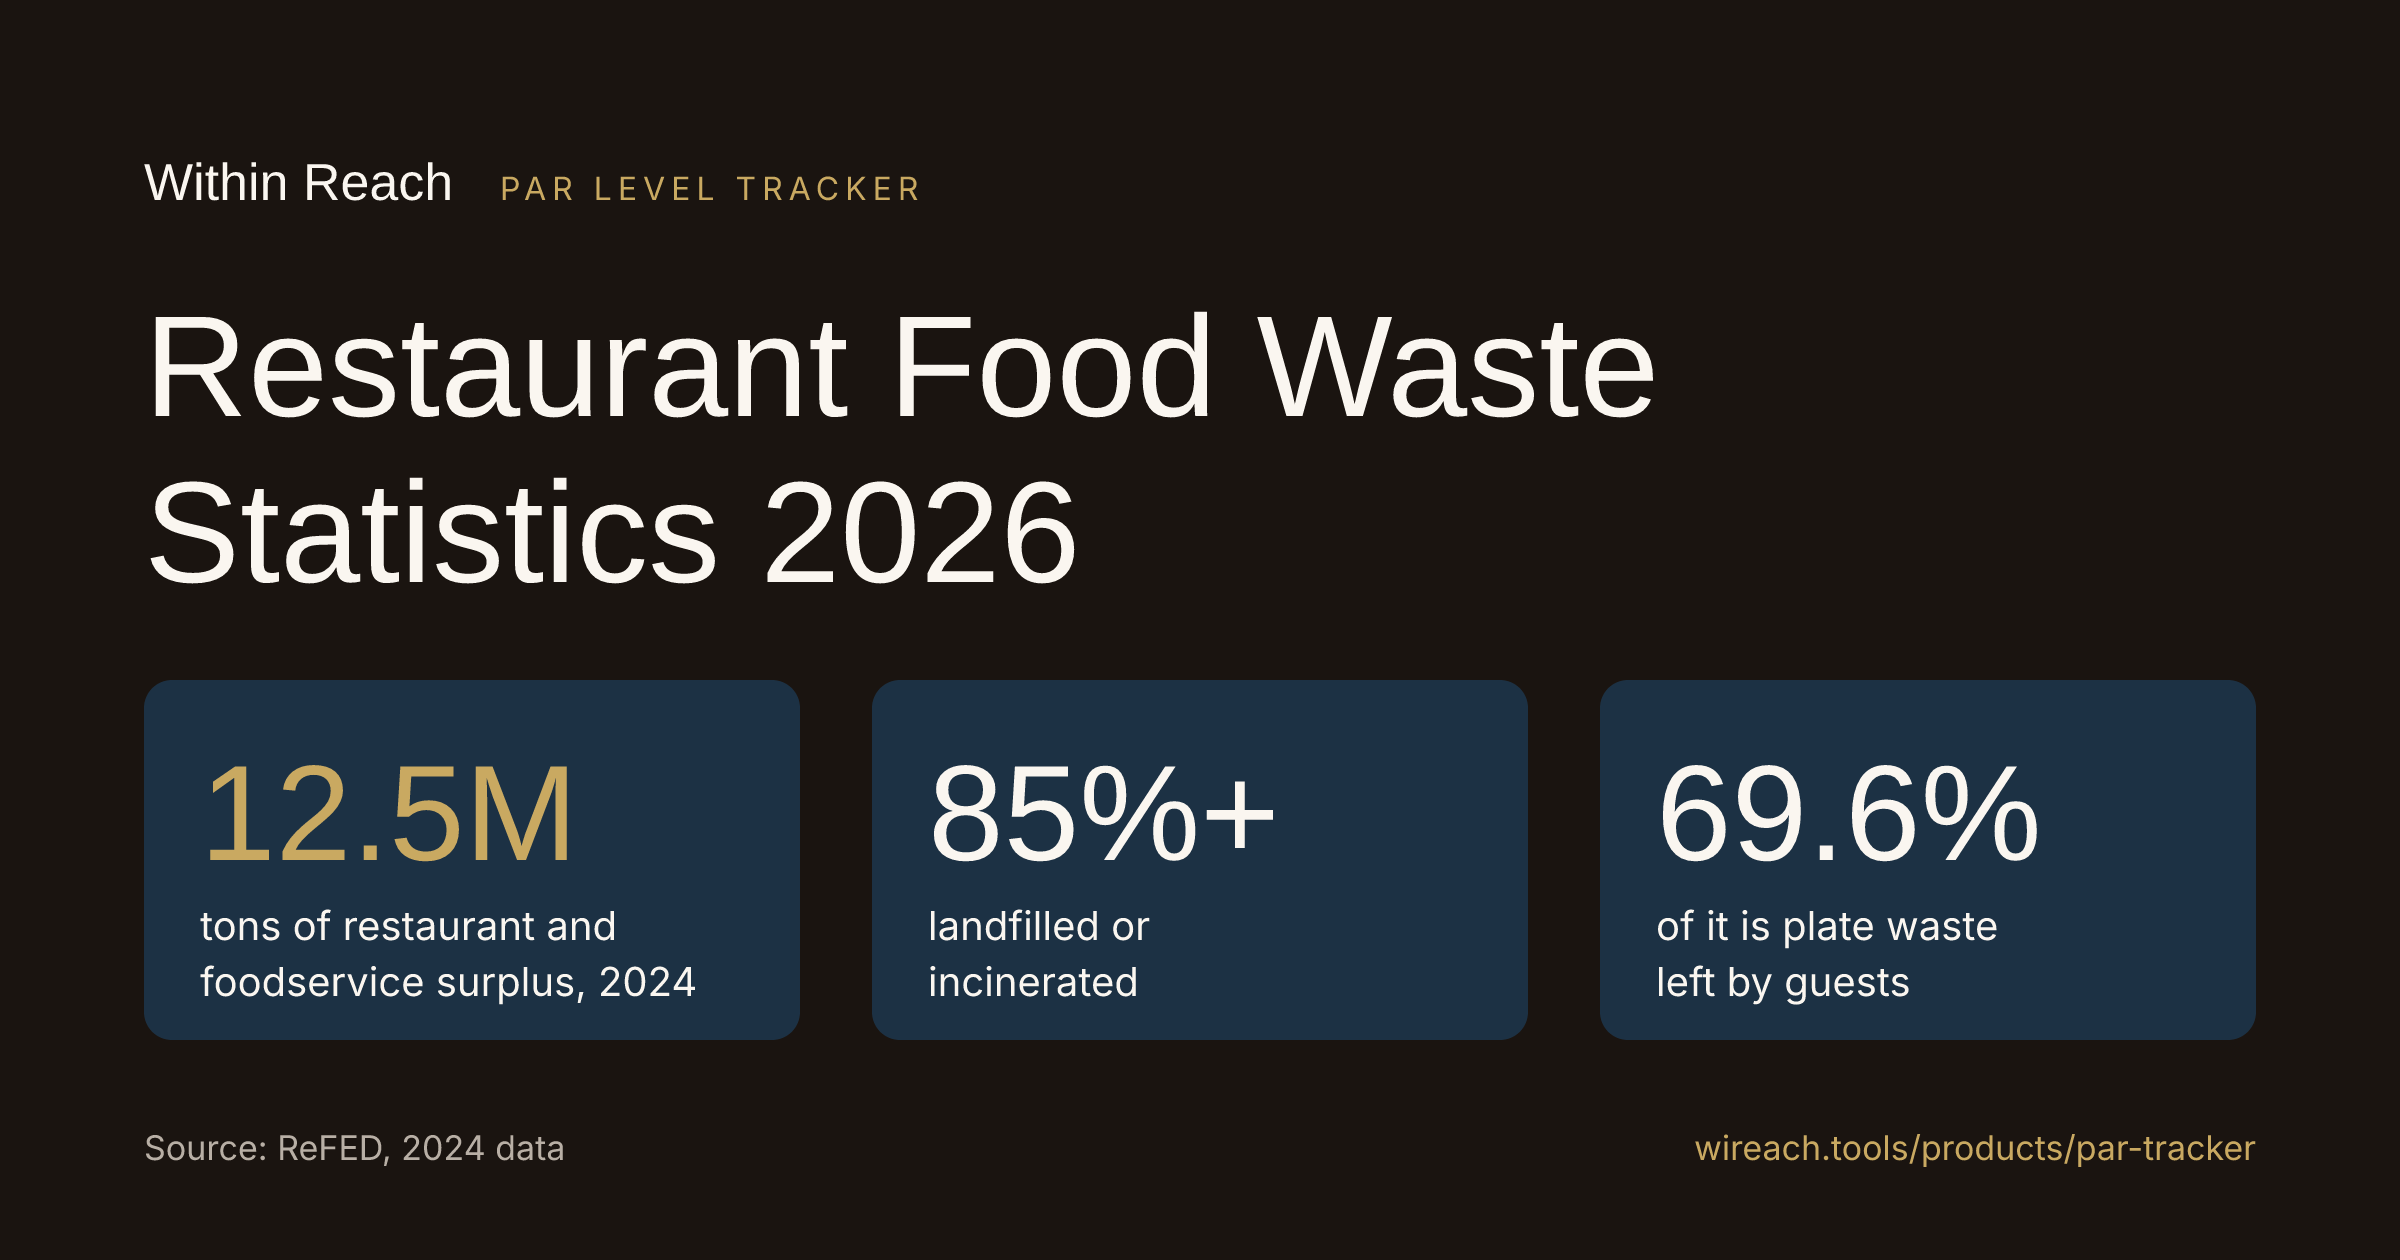
- US restaurants and foodservice generated 12.5 million tons of surplus food in 2024 (ReFED).
- More than 85% of it went to landfill or was incinerated. Less than 1% was donated (ReFED, 2024).
- Plate waste is 69.6% of restaurant and foodservice surplus. Kitchen overproduction is 11.9% (ReFED, 2024).
- Full-service restaurants generated more than 43% of all foodservice surplus (ReFED, 2024).
- Foodservice is 17.9% of all US surplus food (ReFED, 2024).
- The EPA put the food service sector at 26.7 million tons of wasted food, with 72% landfilled (EPA, 2019).
- EPA estimates 39.1 tons a year per full-service restaurant and 40.9 tons per limited-service restaurant (EPA generation factors).
- Every $1 restaurants put into cutting kitchen waste saved $7 on average (Champions 12.3).
- 58 percent of methane leaking from municipal landfills comes from food waste (EPA).
- Only 47 percent of operators said they track food waste (National Restaurant Association, 2018).
Most of that list is plate waste, and you only control part of that with portions. The kitchen part is yours. Over-ordering and over-prepping start with nobody knowing what is already on the shelf. Counting the walk-in against par before the order goes in is the habit that fixes it, and Par Level Tracker par counts at the walk-in is the tool I built for that.
How much food restaurants waste
ReFED is the go-to source here. It models surplus food across the whole US food system every year. "Surplus" means food that was grown or bought and never eaten, whether it was wasted, donated or composted.
- US restaurants and foodservice businesses generated 12.5 million tons of surplus food in 2024.
- That is 17.9% of all US surplus food.
- Full-service restaurants generated more than 43% of the foodservice total.
- Across the whole US food system, surplus food was 70 million tons in 2024, about 29% of the food supply, worth $380 billion.
- Surplus food is 3.5% of US greenhouse gas emissions.
Sources: ReFED, Restaurants and Foodservice, ReFED 2026 Food Waste Report
The EPA counts it a different way. Its food service sector includes restaurants plus hotels, schools, offices, hospitals and more, and its latest full report covers 2019.
- The food service sector generated 26.7 million tons of wasted food in 2019.
- Full and limited-service restaurants alone were 18,337,784 tons of that.
- By my math, restaurants are 68.6% of the EPA food service total (18,337,784 / 26,741,937).
- Food service was 40.4% of the 66.2 million tons of wasted food from retail, food service and homes combined.
Source: EPA, 2019 Wasted Food Report
Do not line the ReFED and EPA numbers up as a trend. Different years, different definitions. Pick one and stick with it.
Plate waste vs kitchen waste
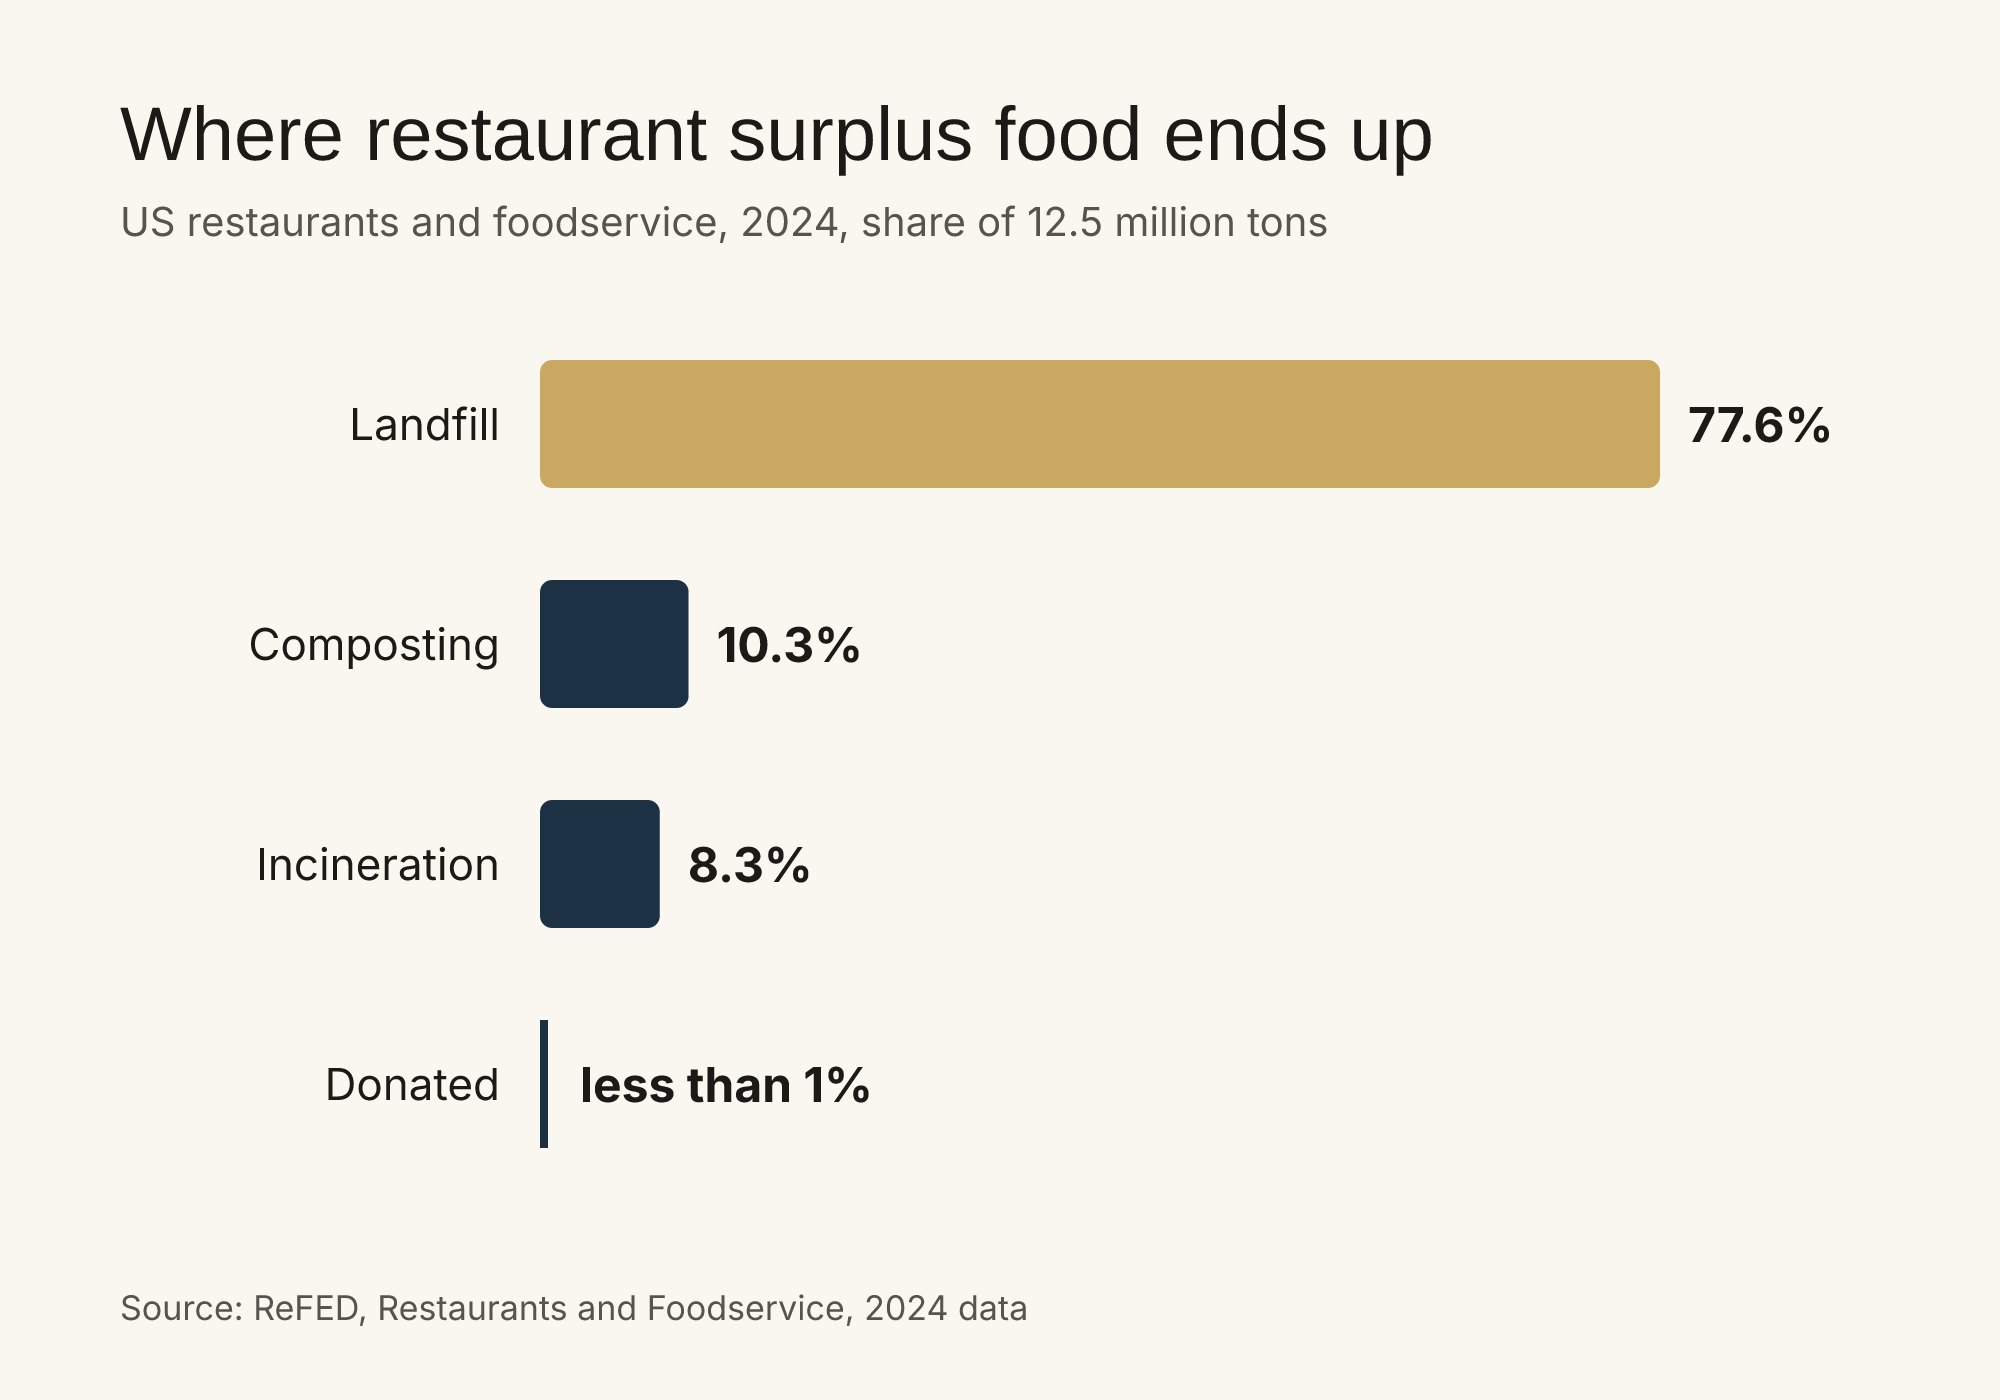
Where restaurant and foodservice surplus ended up in 2024. Less than 1% was donated. Source: ReFED.
ReFED splits restaurant surplus by cause. Two causes carry most of the weight:
| Cause (ReFED, 2024) | Tons | Share of foodservice surplus |
|---|---|---|
| Plate waste | 8.72 million | 69.6% |
| Kitchen overproduction | 1.49 million | 11.9% |
Source: ReFED, Restaurants and Foodservice
Plate waste is what guests leave behind. Portion size and menu design move it. Overproduction is on us: the extra pan of rice, the case of romaine prepped for a Tuesday that ran like a Monday. Smaller number, but it is the one a manager can change by tomorrow.
Vendors that weigh kitchen waste for a living look at it from the purchasing side. Leanpath says 5-15% of kitchen food purchases go to waste (Leanpath). Leanpath sells waste tracking, so treat that as their number, not a government benchmark.
Where restaurant food waste ends up
- 77.6% of restaurant and foodservice surplus went to landfill in 2024: 9.73 million tons.
- 10.3% was composted: 1.29 million tons.
- 8.3% was incinerated: 1.04 million tons.
- Less than 1% was donated.
Source: ReFED, Restaurants and Foodservice
EPA's 2019 numbers tell the same story for the wider food service sector: 72% landfilled, 17% controlled combustion, 8% composted (EPA, 2019 Wasted Food Report).
Landfill is where it does the most damage. Food waste is about 24 percent of municipal solid waste in landfills, and an estimated 58 percent of the methane leaking from those landfills comes from food waste (EPA).
What food waste costs one restaurant
National tons do not mean much on a Friday night. Here is how to bring it down to one store.
- EPA estimates wasted food at 39.1 tons per facility per year for full-service restaurants and 40.9 tons for limited-service. These are the factors EPA uses to build its national totals, not measured store averages (EPA, 2019 Wasted Food Report).
- My math: 39.1 tons is 78,200 pounds a year, about 1,500 pounds a week.
What 5% to 15% looks like in dollars (my math): take a store that buys $8,000 of food a week. At the low end of the Leanpath range, 5% waste is $400 a week, or $20,800 a year. At 15%, it is $1,200 a week, or $62,400 a year. That is before labor to prep it and before the hauling bill.
Your number will be different. Write down what went in the bin this week, what each item costs you, and run it through the restaurant waste cost calculator. It turns a week of waste into a monthly dollar figure and a percent of purchases.
What cutting waste pays back
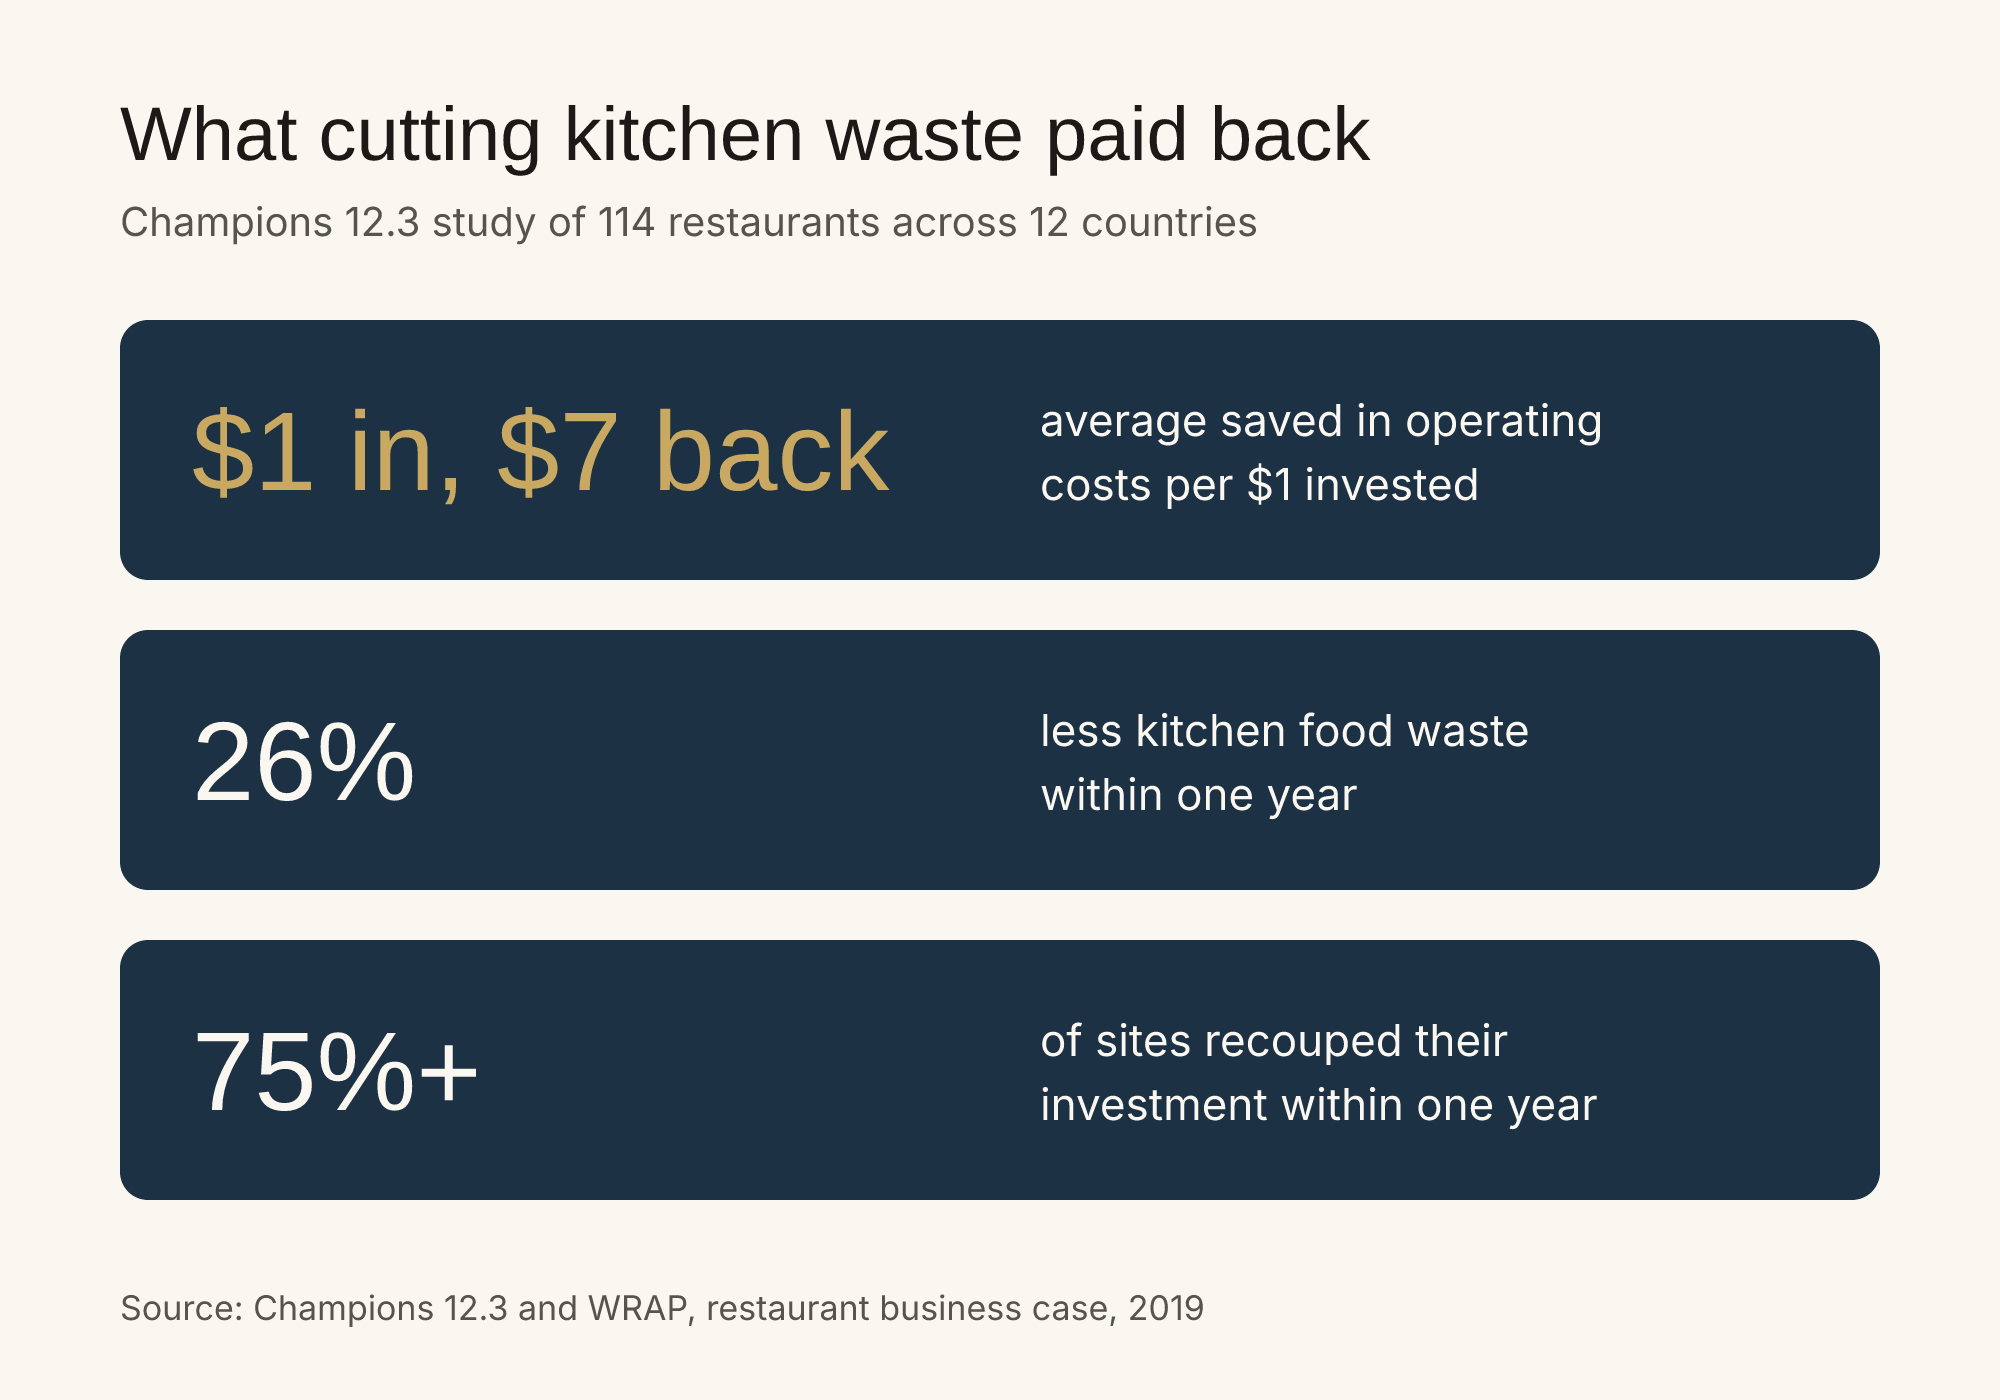
Champions 12.3 study of 114 restaurants across 12 countries.
The best study on this is still the Champions 12.3 business case for restaurants. It looked at cost and savings data from 114 restaurants across 12 countries.
- For every $1 invested in cutting kitchen food waste, restaurants saved $7 in operating costs on average.
- Kitchen food waste fell 26 percent on average within one year.
- Over 75 percent of sites recouped their investment within one year.
- All sites kept their total investment below $20,000 over three years.
Sources: Champions 12.3, WRAP
That matches what I have seen on the floor. The first month you count waste, it drops, because people know somebody is looking.
Food waste beyond restaurants
- USDA estimates US food waste at between 30-40 percent of the food supply.
- USDA's estimate of food loss at the retail and consumer levels was 31 percent, about 133 billion pounds and $161 billion worth of food in 2010.
Source: USDA, Food Loss and Waste
- The world wasted 1.05 billion tonnes of food in 2022 (UNEP Food Waste Index Report 2024).
- Food service accounted for 290 million tonnes of that (UN News).
And on the operator side, the National Restaurant Association's 2018 sustainability survey found 47 percent of operators track food waste, 22 percent donate leftover food and 14 percent compost (National Restaurant Association). That survey is old. I could not find a newer one that asks the same questions.
What operators can do with these numbers
- Weigh it for 2 weeks. One bucket for prep and spoilage, one for plates. You cannot fix what you are guessing at, and in that NRA survey fewer than half of operators were tracking.
- Put a dollar figure on it. Take your real weekly waste and your real weekly food purchases into the waste cost calculator. Compare your percent with the 5% to 15% Leanpath range above.
- Stop ordering from memory. Overproduction and spoilage start with the order. Set a par for every item, count the walk-in before the truck order goes in, and order the gap. Par Level Tracker for walk-in counts against par puts par counts on a tablet at the walk-in. The crew counts by PIN, and shortfalls email you on submit. $12/mo, 14-day free trial.
- Look at portions on your top plate-waste items. If the same side comes back half eaten every night, the portion is the problem, not the guest.
- Line up a donation partner for clean surplus. Less than 1% of restaurant surplus gets donated. That is the easiest number on this page to beat.
Methodology and sources
Numbers come from ReFED, the US Environmental Protection Agency (2019 Wasted Food Report and landfill methane research), USDA, the UN Environment Programme Food Waste Index Report 2024, Champions 12.3 and WRAP, and the National Restaurant Association. ReFED and EPA use different definitions of foodservice and cover different years, so they are reported side by side, not as a trend. EPA per-restaurant figures are generation factors used for national estimates, not measured store averages. Leanpath figures are vendor-reported and labeled that way. Numbers that only appeared on pages without a named original source were left out. Each number is checked against its source on a regular schedule, and this page is updated when newer data is published.
Full source list:
- ReFED, Restaurants and Foodservice
- ReFED 2026 Food Waste Report
- EPA, 2019 Wasted Food Report
- EPA, Quantifying Methane Emissions from Landfilled Food Waste
- USDA, Food Loss and Waste
- UNEP Food Waste Index Report 2024, key messages
- UN News on the Food Waste Index Report 2024
- Champions 12.3, restaurant business case
- WRAP, business case for restaurants
- National Restaurant Association, State of Restaurant Sustainability 2018
- Leanpath
Frequently asked questions
How much food do restaurants waste in the US?
ReFED estimates US restaurants and foodservice businesses generated 12.5 million tons of surplus food in 2024. EPA uses a wider definition of food service that includes schools, hotels and offices, and put that sector at 26.7 million tons of wasted food in 2019.
What percentage of restaurant food waste is plate waste?
ReFED puts plate waste at 8.72 million tons, or 69.6% of restaurant and foodservice surplus in 2024. Overproduction in the kitchen was 1.49 million tons, or 11.9%.
Where does restaurant food waste end up?
In ReFED's 2024 data, 77.6% of foodservice surplus went to landfill, 10.3% was composted and 8.3% was incinerated. Less than 1% was donated. EPA's 2019 report found 72% of food service wasted food was landfilled.
How much food waste does one restaurant produce?
EPA estimates wasted food with a generation factor of 39.1 tons per facility per year for full-service restaurants and 40.9 tons for limited-service restaurants. Those are estimation factors, not measured averages. By WRI math, 39.1 tons is 78,200 pounds a year, about 1,500 pounds a week.
Does reducing food waste save restaurants money?
In a Champions 12.3 study of 114 restaurants across 12 countries, every $1 invested in cutting kitchen food waste saved $7 in operating costs on average. Kitchen waste fell 26 percent within one year, and over 75 percent of sites recouped their investment in that first year.
How often is this page updated?
The sources behind every number on this page are re-checked on a schedule. When a source publishes newer data, the page is updated and the date at the top changes.