Restaurant Labor Cost Statistics (2026): The Numbers, With Sources
Restaurant labor cost statistics, 2026: labor as a share of sales, cost per hour, wage growth and what operators expect next. Every number sourced.
Last updated November 16, 2026. Every number below comes from a linked source, listed with each section.
Labor is the line I look at every night before I leave. Food cost moves when the market moves. Labor moves when somebody on the schedule decides it moves: a cut that did not happen, a closer who clocked in early, a slow Tuesday staffed like a Friday.
This page puts the labor cost numbers worth knowing in one spot: what share of sales labor takes, what an hour of labor really costs, how fast it is rising, and what operators expect next. Government data first, then the National Restaurant Association, then operator surveys. Where I did the math myself, I say so and show it.
Key restaurant labor cost statistics
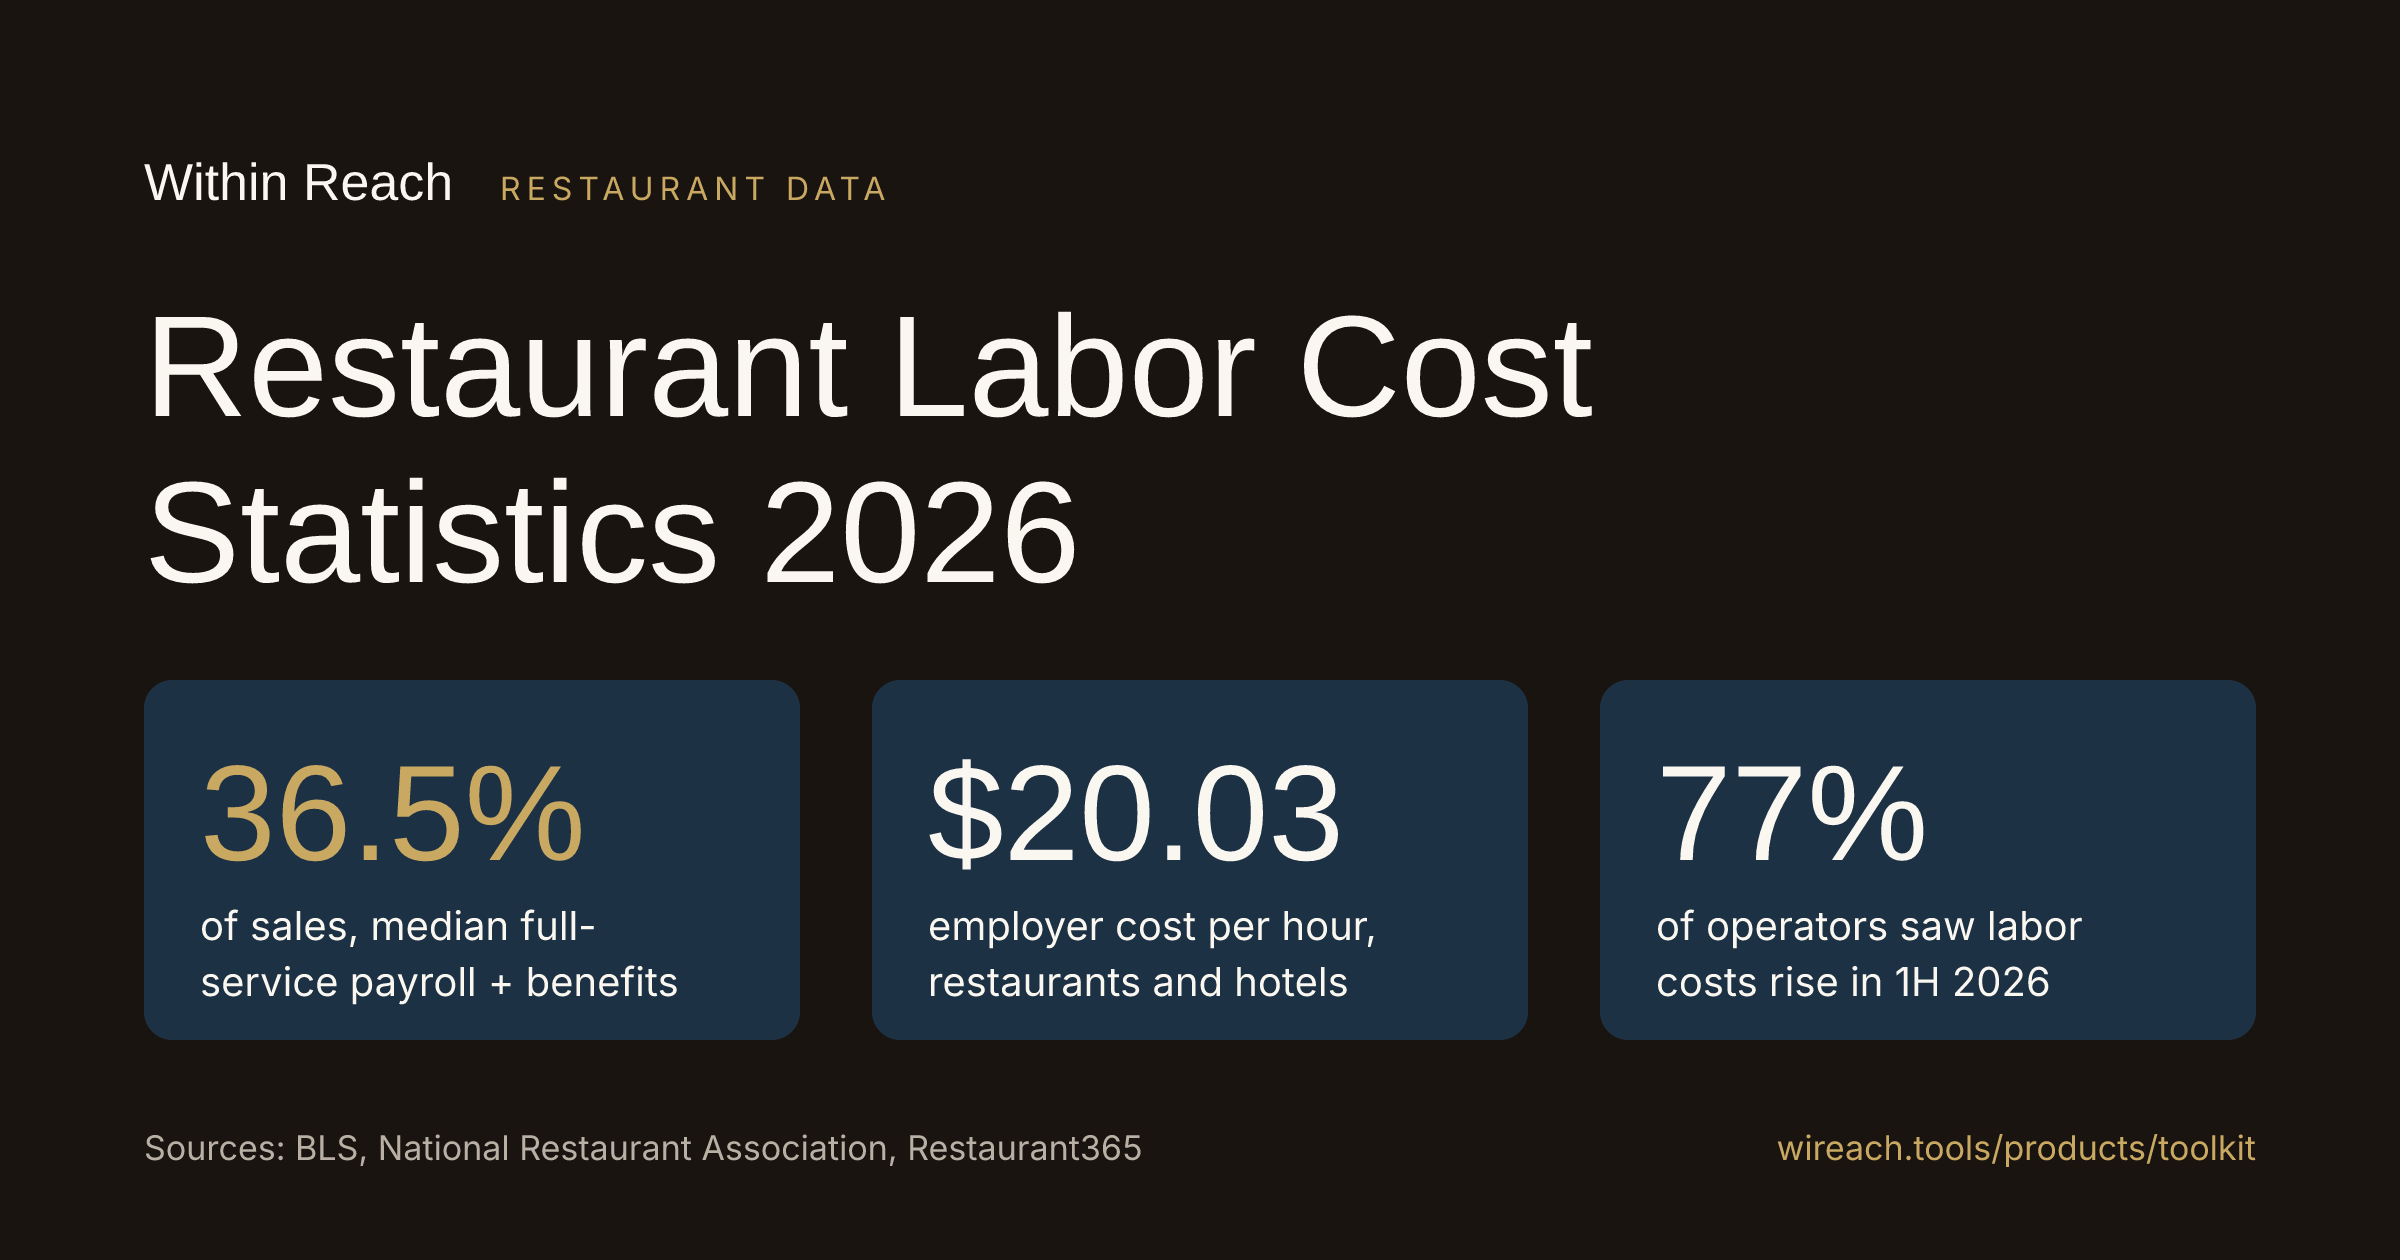
- Payroll and benefits run a median 36.5% of sales in full-service restaurants, the largest single operating expense (National Restaurant Association, 2025).
- Food and labor each take about 33 cents of every sales dollar (National Restaurant Association, July 2026).
- An hour of labor in restaurants and hotels costs employers $20.03: $16.18 in wages and $3.85 in benefits (BLS, June 2026).
- Total compensation in accommodation and food service rose 2.4% in the 12 months ended September 2026, down from 2.8% a year earlier (BLS).
- Restaurant employees' average hourly earnings are up 41% since February 2020 (National Restaurant Association).
- 77% of operators said labor costs went up in the first half of 2026, down from 93% at the start of the year (Restaurant365).
- 61% expect labor costs to keep rising through the rest of 2026 (Restaurant365).
- 33% of operators said their restaurant was not profitable in the first half of 2026 (National Restaurant Association).
Labor cost is not only the hourly rate. It is how many hours you put on the floor and whether the next manager knows what you already did. A closer who does not know you cut two people at 8 PM calls one back in. Shift handoff notes, opening and closing lists and R&M tickets in one place is what the WRI Audits & Repairs app does, so the night does not get re-staffed by accident.
Labor as a share of restaurant sales
The National Restaurant Association's 2025 Restaurant Operations Data Abstract is built on financial and operating data from more than 900 restaurants.
- Payroll and benefits: a median 36.5% of sales in full service. Labor is the largest single operating expense.
- Prime cost (food, beverage and labor together): a median 65 cents of every sales dollar in limited service.
- Median income before taxes was 2.8% of sales in full service and 4.0% in limited service.
Source: National Restaurant Association, August 2025
Put those side by side and you see the problem. Labor is 36.5 points of sales and pre-tax profit is 2.8. There is not much room between those two numbers for a sloppy schedule.
What that looks like for one store (my math): a full-service store doing $1 million in sales at the 36.5% median spends about $365,000 a year on payroll and benefits (1,000,000 x 0.365). Every single point of labor is $10,000.
Run your own numbers in the restaurant labor cost calculator, then check food and labor together in the prime cost calculator.
What an hour of restaurant labor really costs
The BLS Employer Costs for Employee Compensation survey breaks an hour worked into wages and each type of benefit. Restaurants are grouped with hotels as accommodation and food services.
| June 2026, per hour worked | Accommodation and food services | All private industry |
|---|---|---|
| Total compensation | $20.03 | $46.89 |
| Wages and salaries | $16.18 (80.8%) | 70.0% of compensation |
| Total benefits | $3.85 (19.2%) | $14.07 (30.0%) |
Source: BLS Employer Costs for Employee Compensation, June 2026
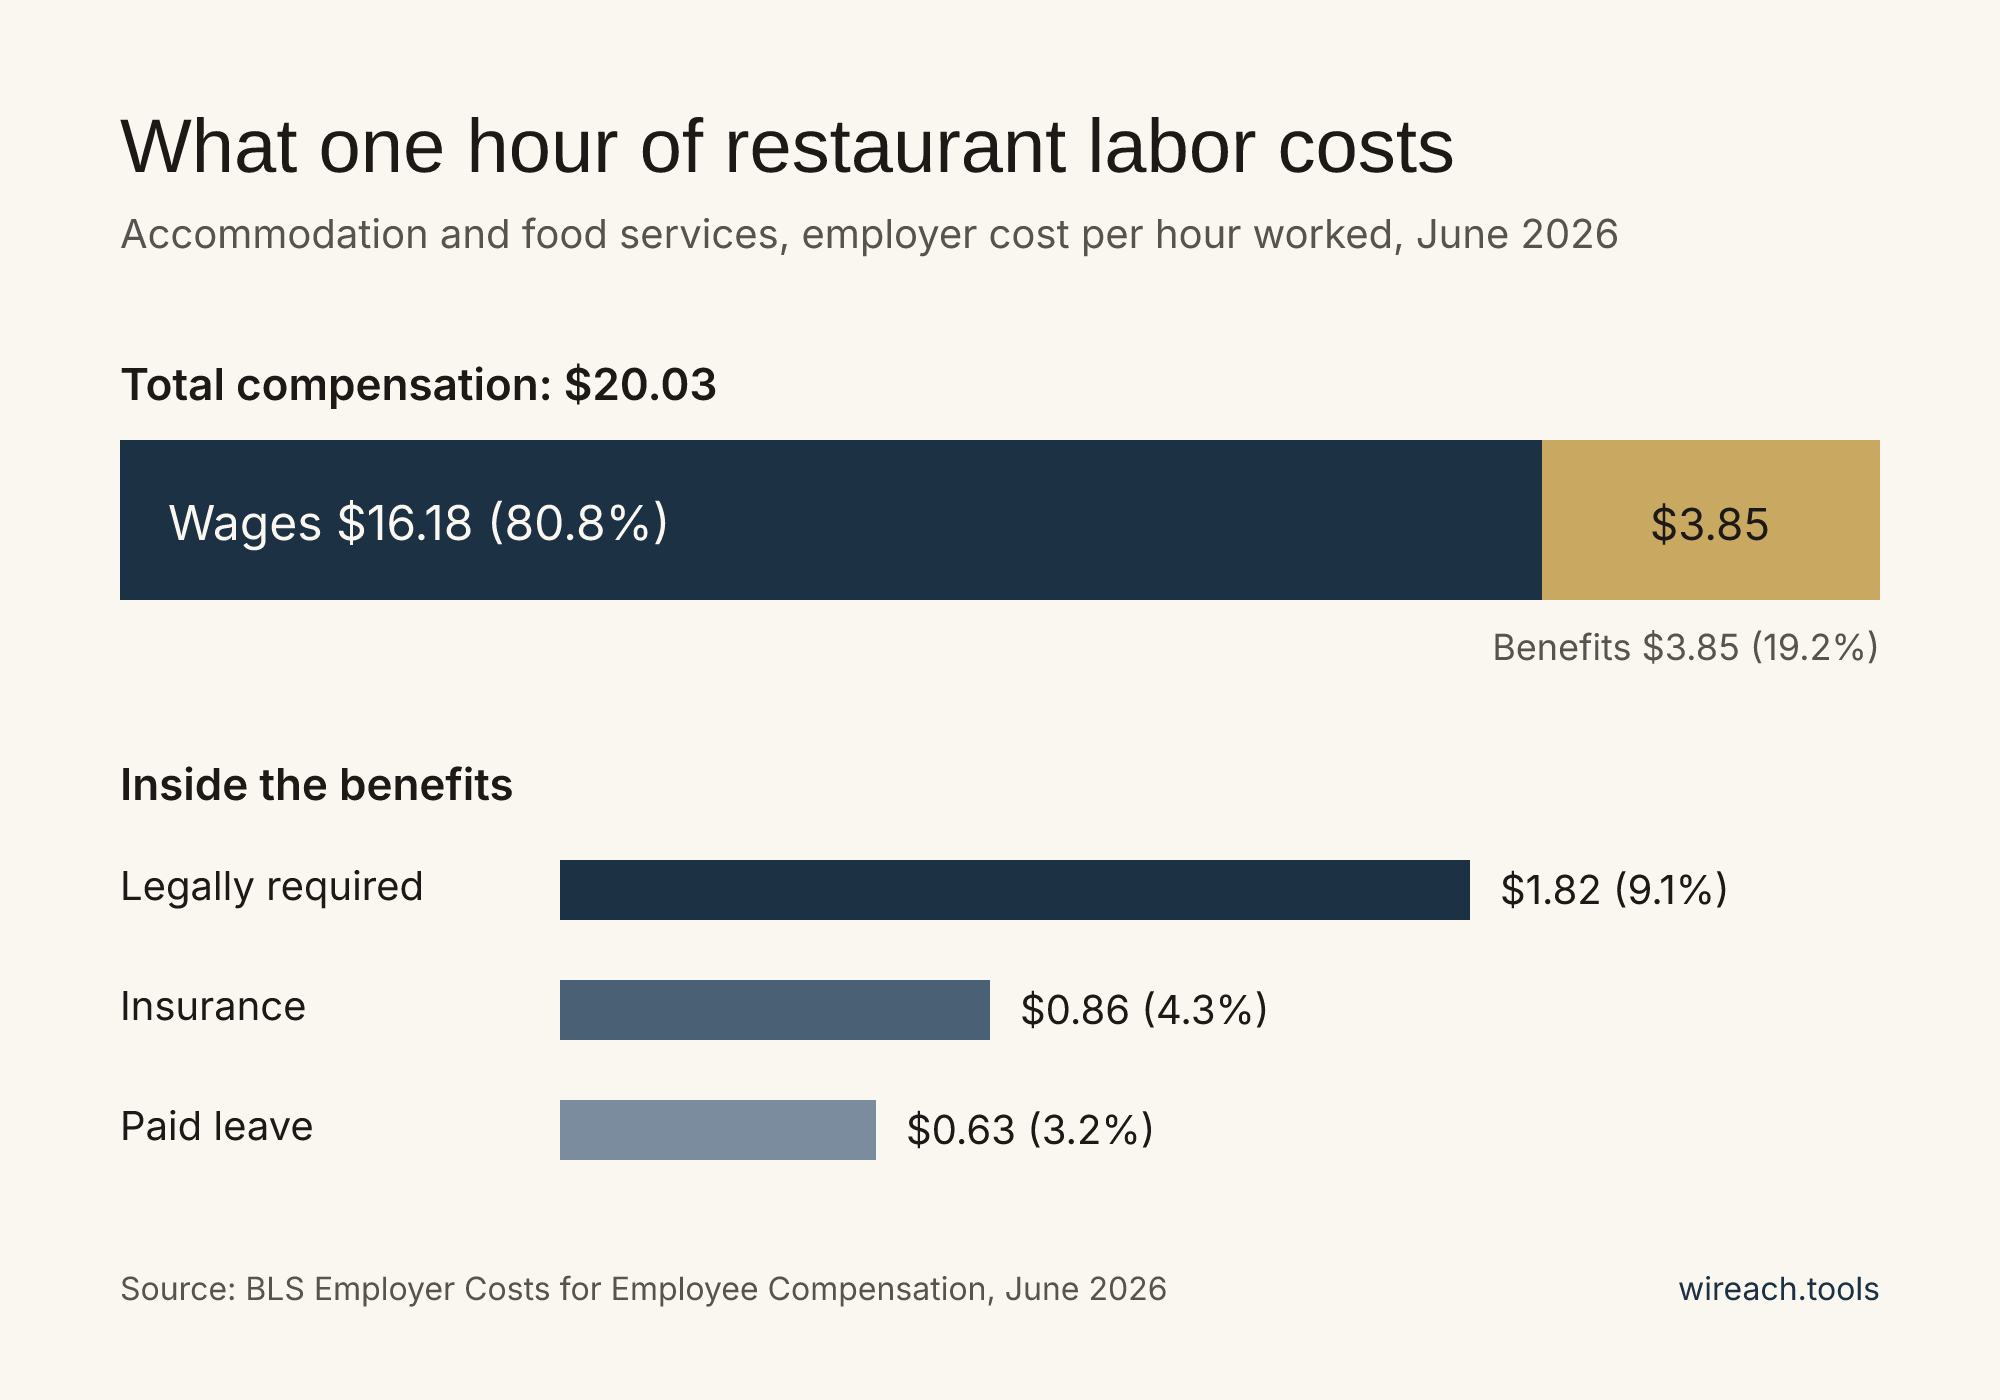
One hour of restaurant and hotel labor, June 2026. The wage is only part of it.
- Legally required benefits were $1.82 an hour, 9.1% of compensation.
- Insurance was $0.86 an hour (4.3%). Paid leave was $0.63 (3.2%).
- My math: total compensation of $20.03 against a $16.18 wage means an hour costs about 24% more than the wage alone (20.03 / 16.18 = 1.238).
That 24% is why I tell new managers to stop thinking in wage dollars. When you leave someone on for an extra hour, you pay the whole hour, not just the rate on their offer letter.
How fast restaurant labor costs are rising
The BLS Employment Cost Index tracks the cost of the same jobs over time, so it is the cleanest read on labor cost growth.
| 12-month change | Sep 2025 | Sep 2026 |
|---|---|---|
| Accommodation and food service, total compensation | 2.8% | 2.4% |
| Accommodation and food service, wages and salaries | 2.9% | 2.1% |
| All private industry, total compensation | 3.4% |
Source: BLS Employment Cost Index, September 2026
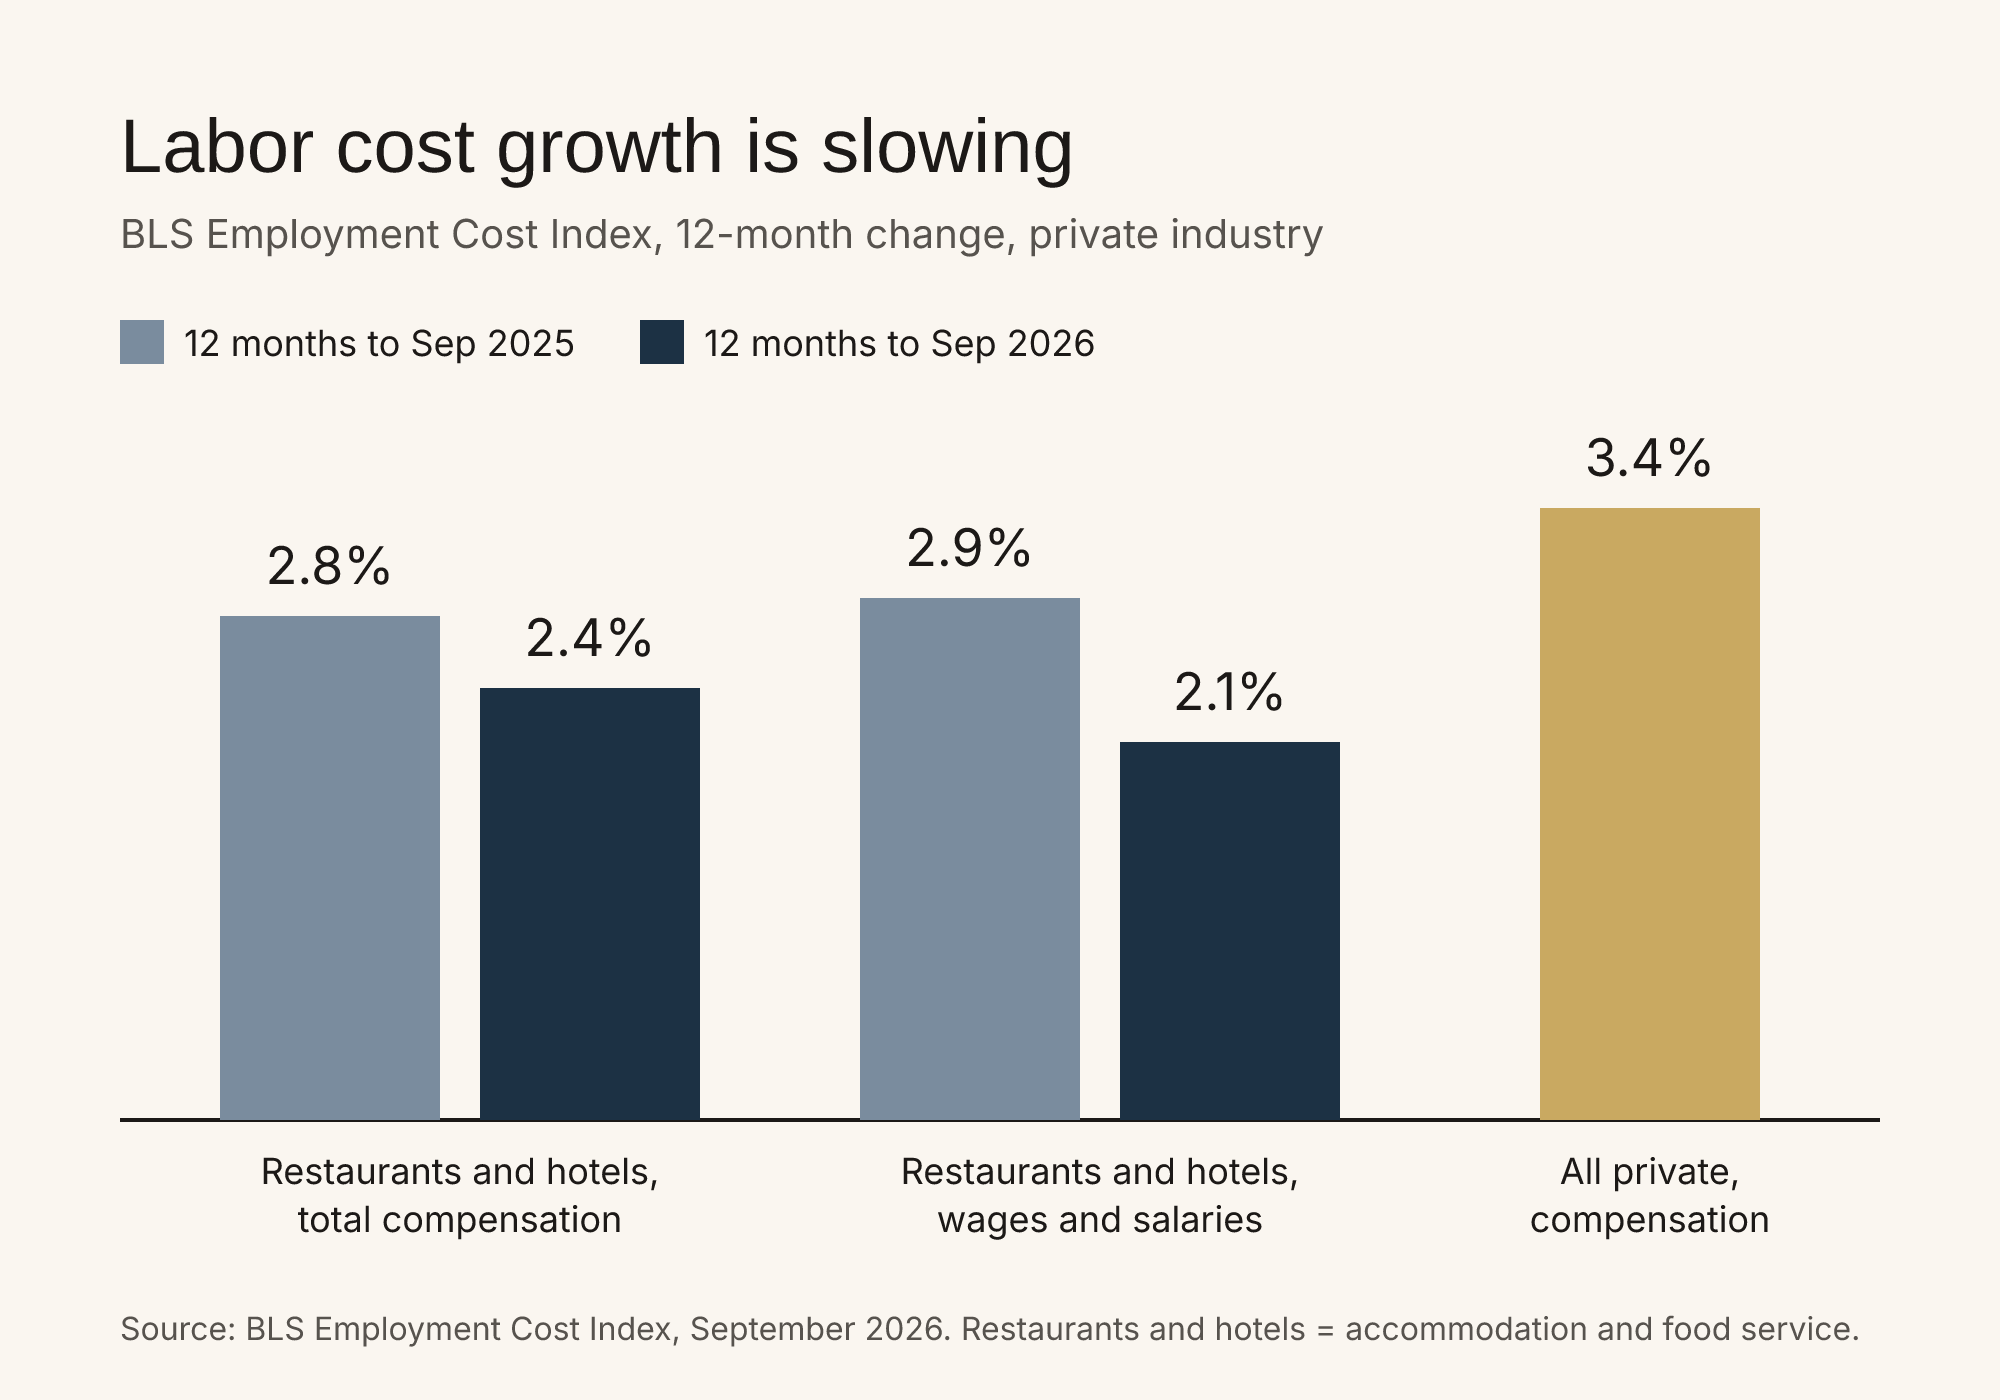
Restaurant and hotel labor costs are still rising, just slower than the rest of private industry.
- All private industry wages and salaries rose 3.1% over the same 12 months.
- Leisure and hospitality average hourly earnings were $23.90 in October 2026 (preliminary), up from $23.01 a year earlier. My math: that is about 3.9% (23.90 / 23.01 = 1.0387). Average weekly earnings were $609.45 (BLS, Table B-3).
- Total private average hourly earnings were $38.00. My math: leisure and hospitality pays about 63% of that (23.90 / 38.00 = 0.629).
- Over the long run, restaurant employees' average hourly earnings are up 41% since February 2020, while wholesale food prices are up 35% (National Restaurant Association).
Growth is slowing. The level is not coming back down. Plan for a higher base, not a return to 2019.
What operators are reporting in 2026
Restaurant365 surveyed more than 420 operators representing nearly 10,000 locations for its 2026 mid-year report.
- 77% said labor costs increased in the first half of 2026, down from 93% at the start of the year.
- Of those, 65% saw increases of 1% to 5%, 29% saw 6% to 14%, and 6% saw more than 15%.
- 61% expect labor costs to keep rising through the rest of 2026, down from 87% at the start of the year.
- Staffing shows up in operations: 64% are running below full capacity, 17% have limited operating hours, 12% moved to a smaller menu and 7% have closed on days they would normally be open.
- Only 14% of operators have 76% or more of their team cross-trained to work more than one role.
Source: Restaurant365, State of the Restaurant Industry 2026 Midyear
The National Restaurant Association's 2026 outlook says more than 9 in 10 operators cite food, labor, insurance, energy and swipe fees as significant challenges (National Restaurant Association, February 2026).
Who is on the payroll
- Food services and drinking places employed 12,383,700 people in October 2026, seasonally adjusted, up from 12,326,500 a year earlier (FRED, series CES7072200001). My math: about 57,200 more jobs in 12 months.
- Full-service staffing is still nearly 200,000 jobs below pre-pandemic levels (National Restaurant Association).
- Workers age 16 to 19 make up 20% of the industry workforce, and there were roughly 250,000 fewer of them in the labor force in the first half of 2026 than a year earlier (same source).
Fewer teens and full-service still short-staffed means the people you have are worth keeping. Every new hire you train is labor you pay for twice. The turnover side of this is broken down in restaurant employee turnover statistics.
What operators can do with these numbers
- Know your number weekly, not monthly. Labor dollars divided by sales for the week. Compare it with the 36.5% full-service median, and remember every point is real money.
- Budget the whole hour. Use total compensation, not the wage. In restaurants and hotels that is about 24% above the rate.
- Cross-train on purpose. Only 14% of operators have most of their crew cross-trained. A person who can work two stations is how you cut an hour without hurting the guest.
- Write down every cut and every call-in. The labor you lose is usually lost at shift change. Handoff notes, open and close lists and vendor contacts on one phone app is how Audits & Repairs keeps shift handoffs straight, so the next manager sees who went home and why.
Methodology and sources
Numbers come from the Bureau of Labor Statistics (Employer Costs for Employee Compensation, Employment Cost Index, Current Employment Statistics), FRED, the National Restaurant Association and Restaurant365. BLS groups restaurants with hotels in accommodation and food services, and with arts and recreation in leisure and hospitality, so those figures are broader than restaurants alone. The latest monthly BLS earnings are preliminary and can be revised. The National Restaurant Association labor share figures are medians from participating operators, and Restaurant365 figures are survey responses, not audited payroll. I left out wage law, tip credits and minimum wage changes; this page covers cost, not compliance. Each number is checked against its source on a regular schedule, and this page is updated when newer data is published.
Frequently asked questions
What percentage of sales should labor cost in a restaurant?
The National Restaurant Association's 2025 Restaurant Operations Data Abstract puts payroll and benefits at a median 36.5% of sales for full-service restaurants. In limited service, prime cost (food, beverage and labor together) ran a median 65 cents of every sales dollar. The Association also says food and labor each take about 33 cents of every sales dollar.
How much does an hour of restaurant labor cost an employer?
BLS puts total employer compensation in accommodation and food services at $20.03 per hour worked in June 2026. Of that, $16.18 is wages and salaries and $3.85 is benefits, including $1.82 in legally required benefits.
How fast are restaurant labor costs rising?
The BLS Employment Cost Index shows total compensation in accommodation and food service up 2.4% in the 12 months ended September 2026, down from 2.8% a year earlier. Wages and salaries rose 2.1%, down from 2.9%. Across all private industry, compensation rose 3.4%.
Are restaurant labor costs still going up in 2026?
For most operators, yes, but slower. In the Restaurant365 mid-year survey, 77% of operators said labor costs increased in the first half of 2026, down from 93% at the start of the year. 61% expect labor costs to keep rising through the rest of 2026.
How much have restaurant wages gone up since 2020?
The National Restaurant Association reports that average hourly earnings of restaurant employees have risen 41% since February 2020. BLS shows leisure and hospitality average hourly earnings at $23.90 in October 2026 (preliminary), up from $23.01 a year earlier.
How often is this page updated?
The sources behind every number on this page are re-checked on a schedule. When a source publishes newer data, the page is updated and the date at the top changes.