Restaurant Employee Absenteeism Statistics (2026): The Numbers, With Sources
Restaurant employee absenteeism statistics, 2026: absence rates for food service workers, sick workers and call-off patterns. Every number sourced.
Last updated November 7, 2026. Every number below comes from a linked source, listed with each section.
I have decades of restaurant knowledge. The text at 5:40 AM that says "I can't make it today" has started more bad shifts for me than any broken fryer. You can fix a fryer. A missing opener means the manager is on the line, the prep is late and lunch starts behind.
This page puts the absenteeism numbers worth knowing in one place: how often restaurant workers miss work, why they miss it, what happens when sick people come in anyway, and what the call-off pattern looks like. Government data first, then industry research. Where I did the math myself, I say so and show it.
Key restaurant absenteeism statistics
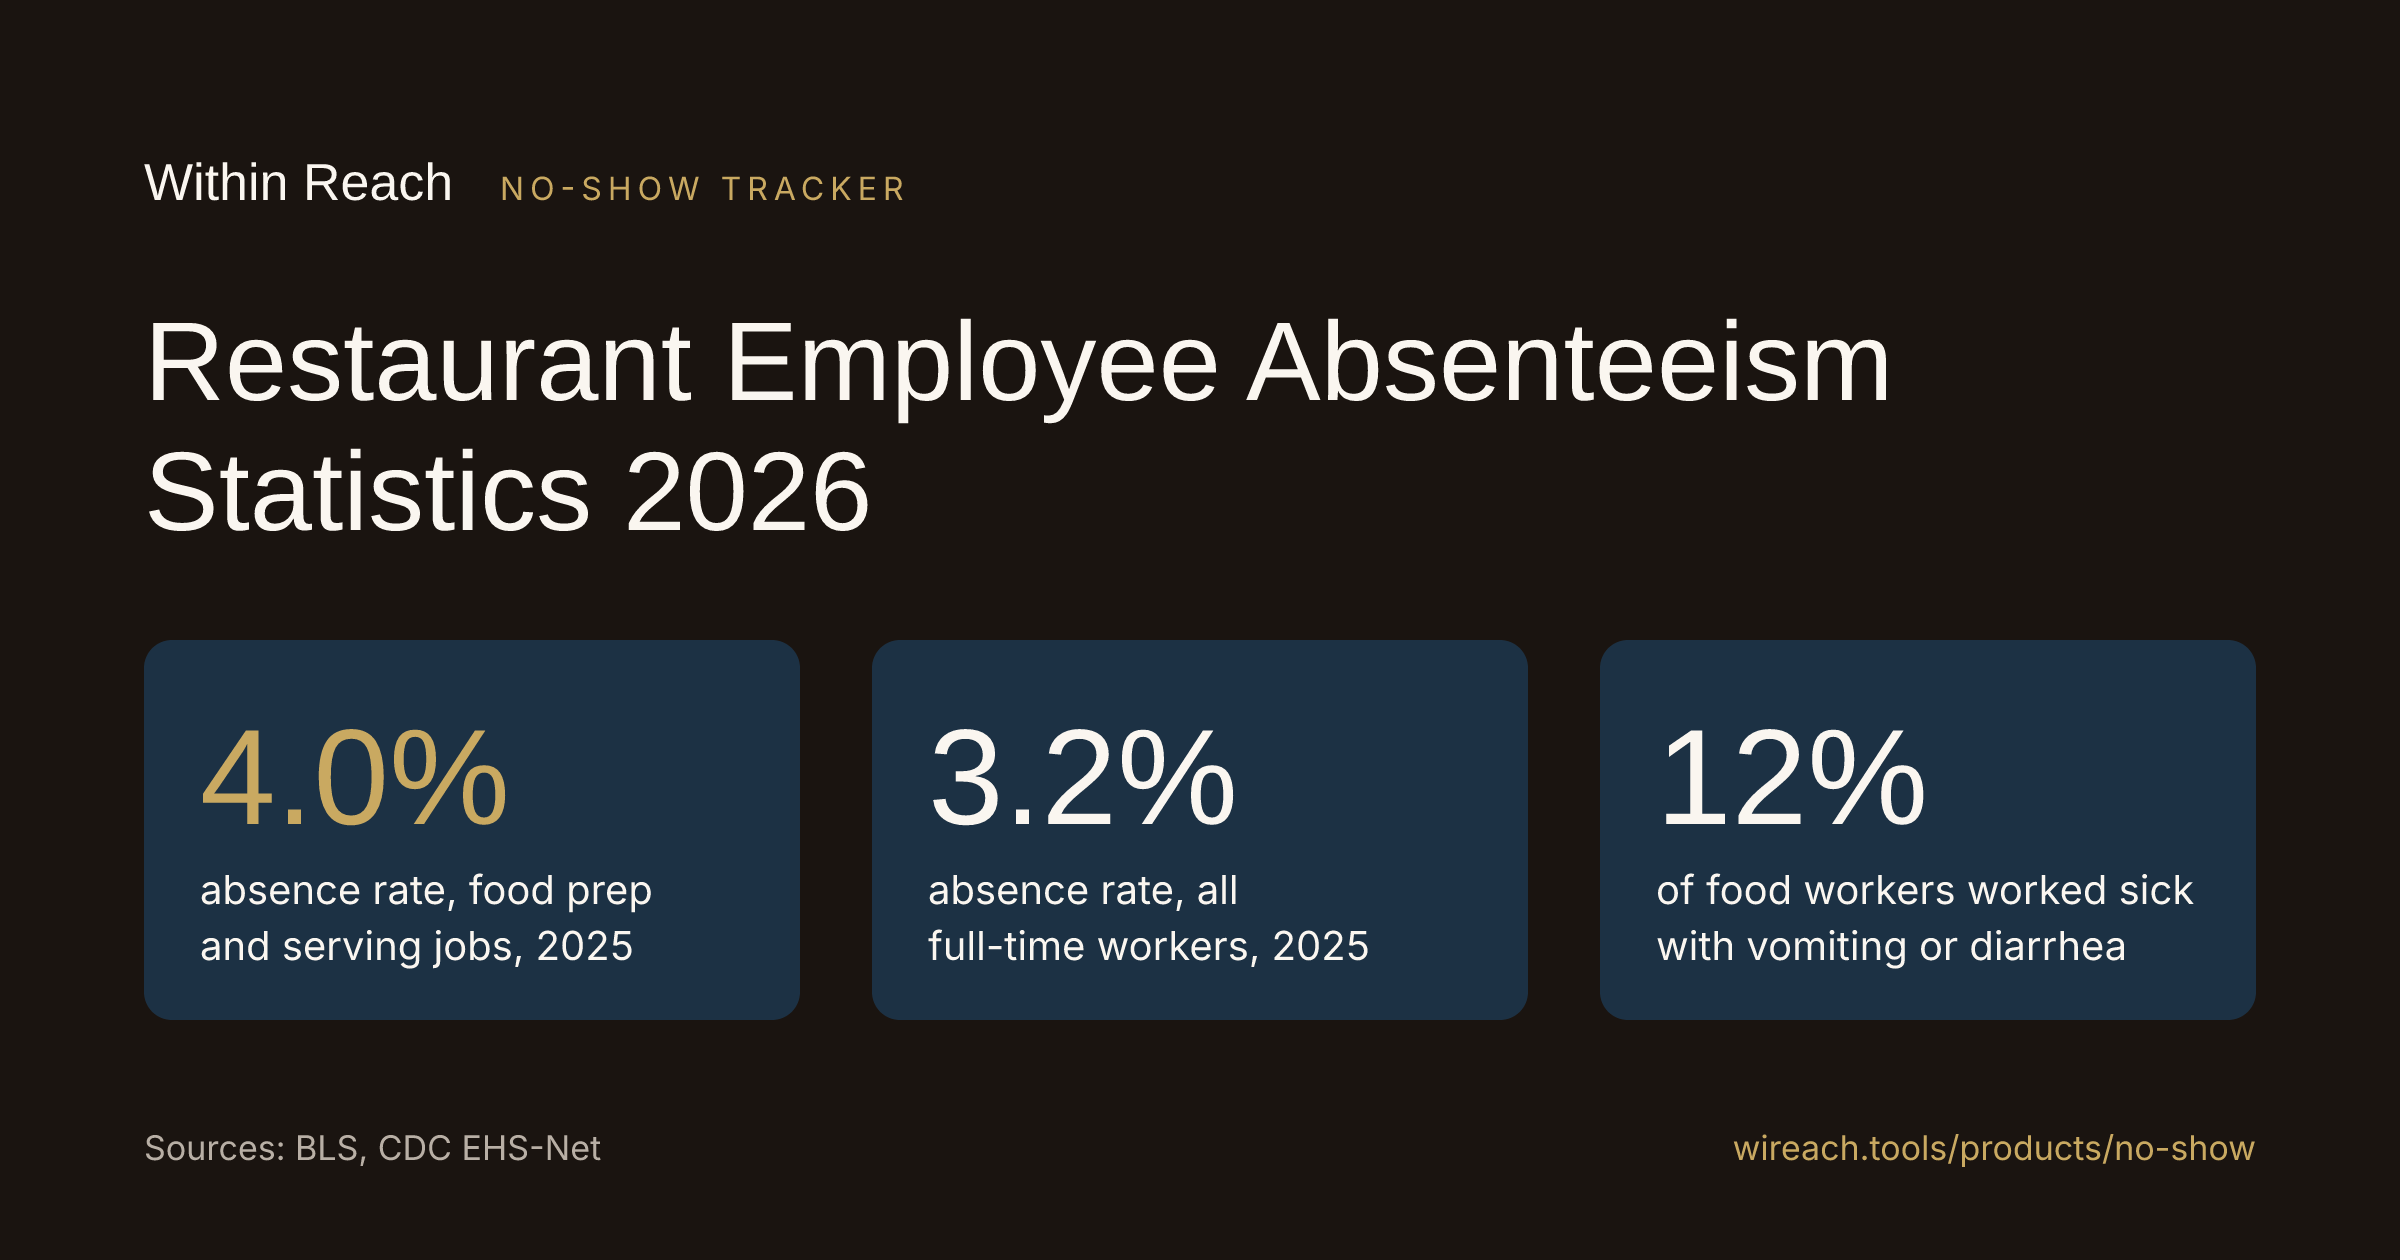
- Full-time food preparation and serving workers had a 4.0% absence rate in 2025, against 3.2% for all workers (BLS).
- My math: that is about 25% higher than the all-worker rate (4.0 / 3.2 = 1.25).
- In the food services and drinking places industry, the absence rate was 3.5% (BLS, 2025).
- Illness or injury drove 2.8% of the 4.0%, so about 70% of food prep and serving absences are people out sick or hurt (BLS, 2025, my math).
- My math: about 168,000 full-time food prep and serving workers are out in an average week (BLS, 2025).
- 12% of food workers said they had worked while sick with vomiting or diarrhea (CDC EHS-Net).
- Nearly half of restaurant-related outbreaks are caused by sick food workers (CDC).
- Only 29% of restaurants offer paid sick days, while 42% of employees put them at the top of their wish list (7shifts, 2026).
- Saturday was the most common day for restaurant no-shows in 7shifts data from 150,000+ restaurant pros (7shifts, 2017).
An absence is not the problem by itself. The problem is finding out at 5:40 AM that it is the third Saturday in a row for the same person. Logging every call-off as it happens, and getting told when someone crosses your line, is what the WRI No-Show Tracker for restaurant call-offs does. Call-offs go in with 4 taps, and you get a pattern alert when an employee crosses your threshold.
How often restaurant workers miss work (BLS data)
The Bureau of Labor Statistics measures absences in the Current Population Survey. A worker who usually puts in 35 or more hours counts as absent if they worked less than 35 hours in the survey week because of their own illness or injury or another personal reason. Vacation, personal days and holidays do not count. The absence rate is the share of full-time workers with an absence in an average week.
| Group, 2025 | Absence rate |
|---|---|
| Food preparation and serving related occupations | 4.0% |
| Office and administrative support occupations | 3.9% |
| Health care and social assistance | 3.8% |
| Service occupations | 3.7% |
| Food services and drinking places | 3.5% |
| Accommodation and food services | 3.4% |
| All full-time workers | 3.2% |
| Management, professional and related | 3.0% |
| Manufacturing | 2.9% |
Source: BLS, Current Population Survey, table 47, 2025 annual averages
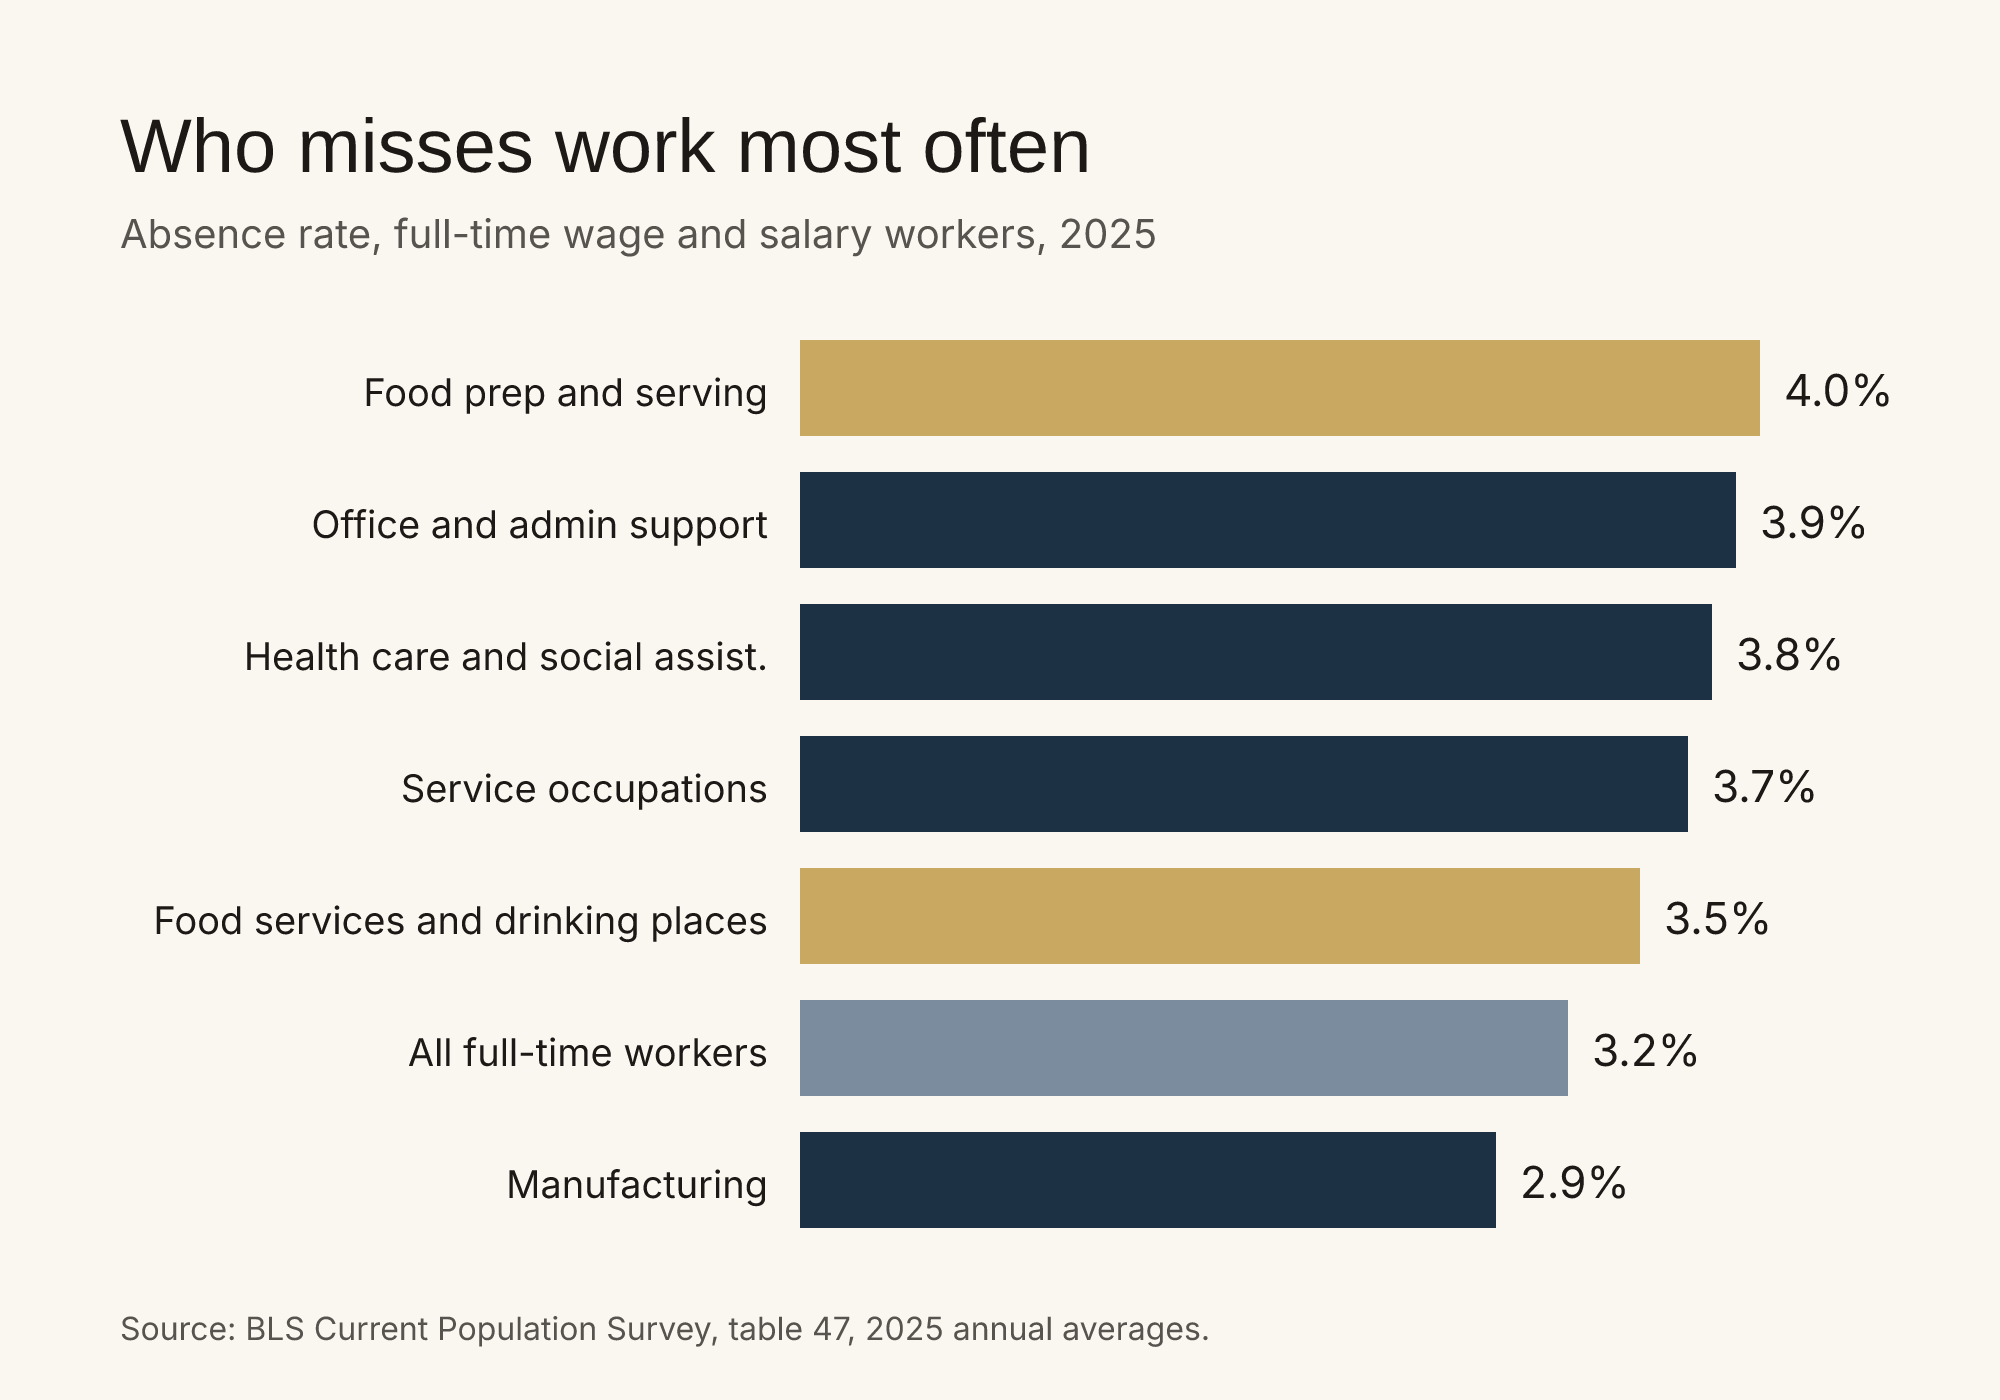
Of the groups on this page, the people who cook and serve the food miss work most often.
- Retail trade matched accommodation and food services at 3.4%.
- There were 4,198,000 full-time wage and salary workers in food preparation and serving occupations in 2025, and 4,605,000 in food services and drinking places.
- My math: at a 4.0% rate, a crew of 25 full-time cooks and servers has about 1 person out in a typical week (25 x 0.040 = 1.0). Across the whole occupation that is about 168,000 people (4,198,000 x 0.040 = 167,920).
Those are averages. You do not get one person out every week, nice and even. You get a quiet month and then three call-offs on the same Friday.
Why restaurant workers are absent
BLS splits every absence into illness or injury and other reasons.
| 2025 absence rate | Illness or injury | Other reasons |
|---|---|---|
| Food preparation and serving occupations | 2.8% | 1.1% |
| Food services and drinking places | 2.5% | |
| All full-time workers | 2.2% |
Source: BLS, table 47, 2025
- My math: illness or injury is about 7 in 10 food prep and serving absences (2.8 / 4.0 = 0.70).
- The lost worktime rate, hours absent as a percent of hours usually worked, was 1.7% for food prep and serving workers, the same as all workers. In food services and drinking places it was 1.5%.
That second point matters. Restaurant people miss work more often than average, but they do not lose more total hours. My read: a lot of these are partial shifts, the cook who leaves at noon, the server who comes in two hours late. Every one of those still leaves a hole on the floor.
Is restaurant absenteeism getting worse?
| Absence rate | 2024 | 2025 |
|---|---|---|
| Food preparation and serving occupations | 3.8% | 4.0% |
| Food services and drinking places | 3.2% | 3.5% |
| All full-time workers | 3.2% | 3.2% |
Sources: BLS, table 47, 2024 and BLS, table 47, 2025
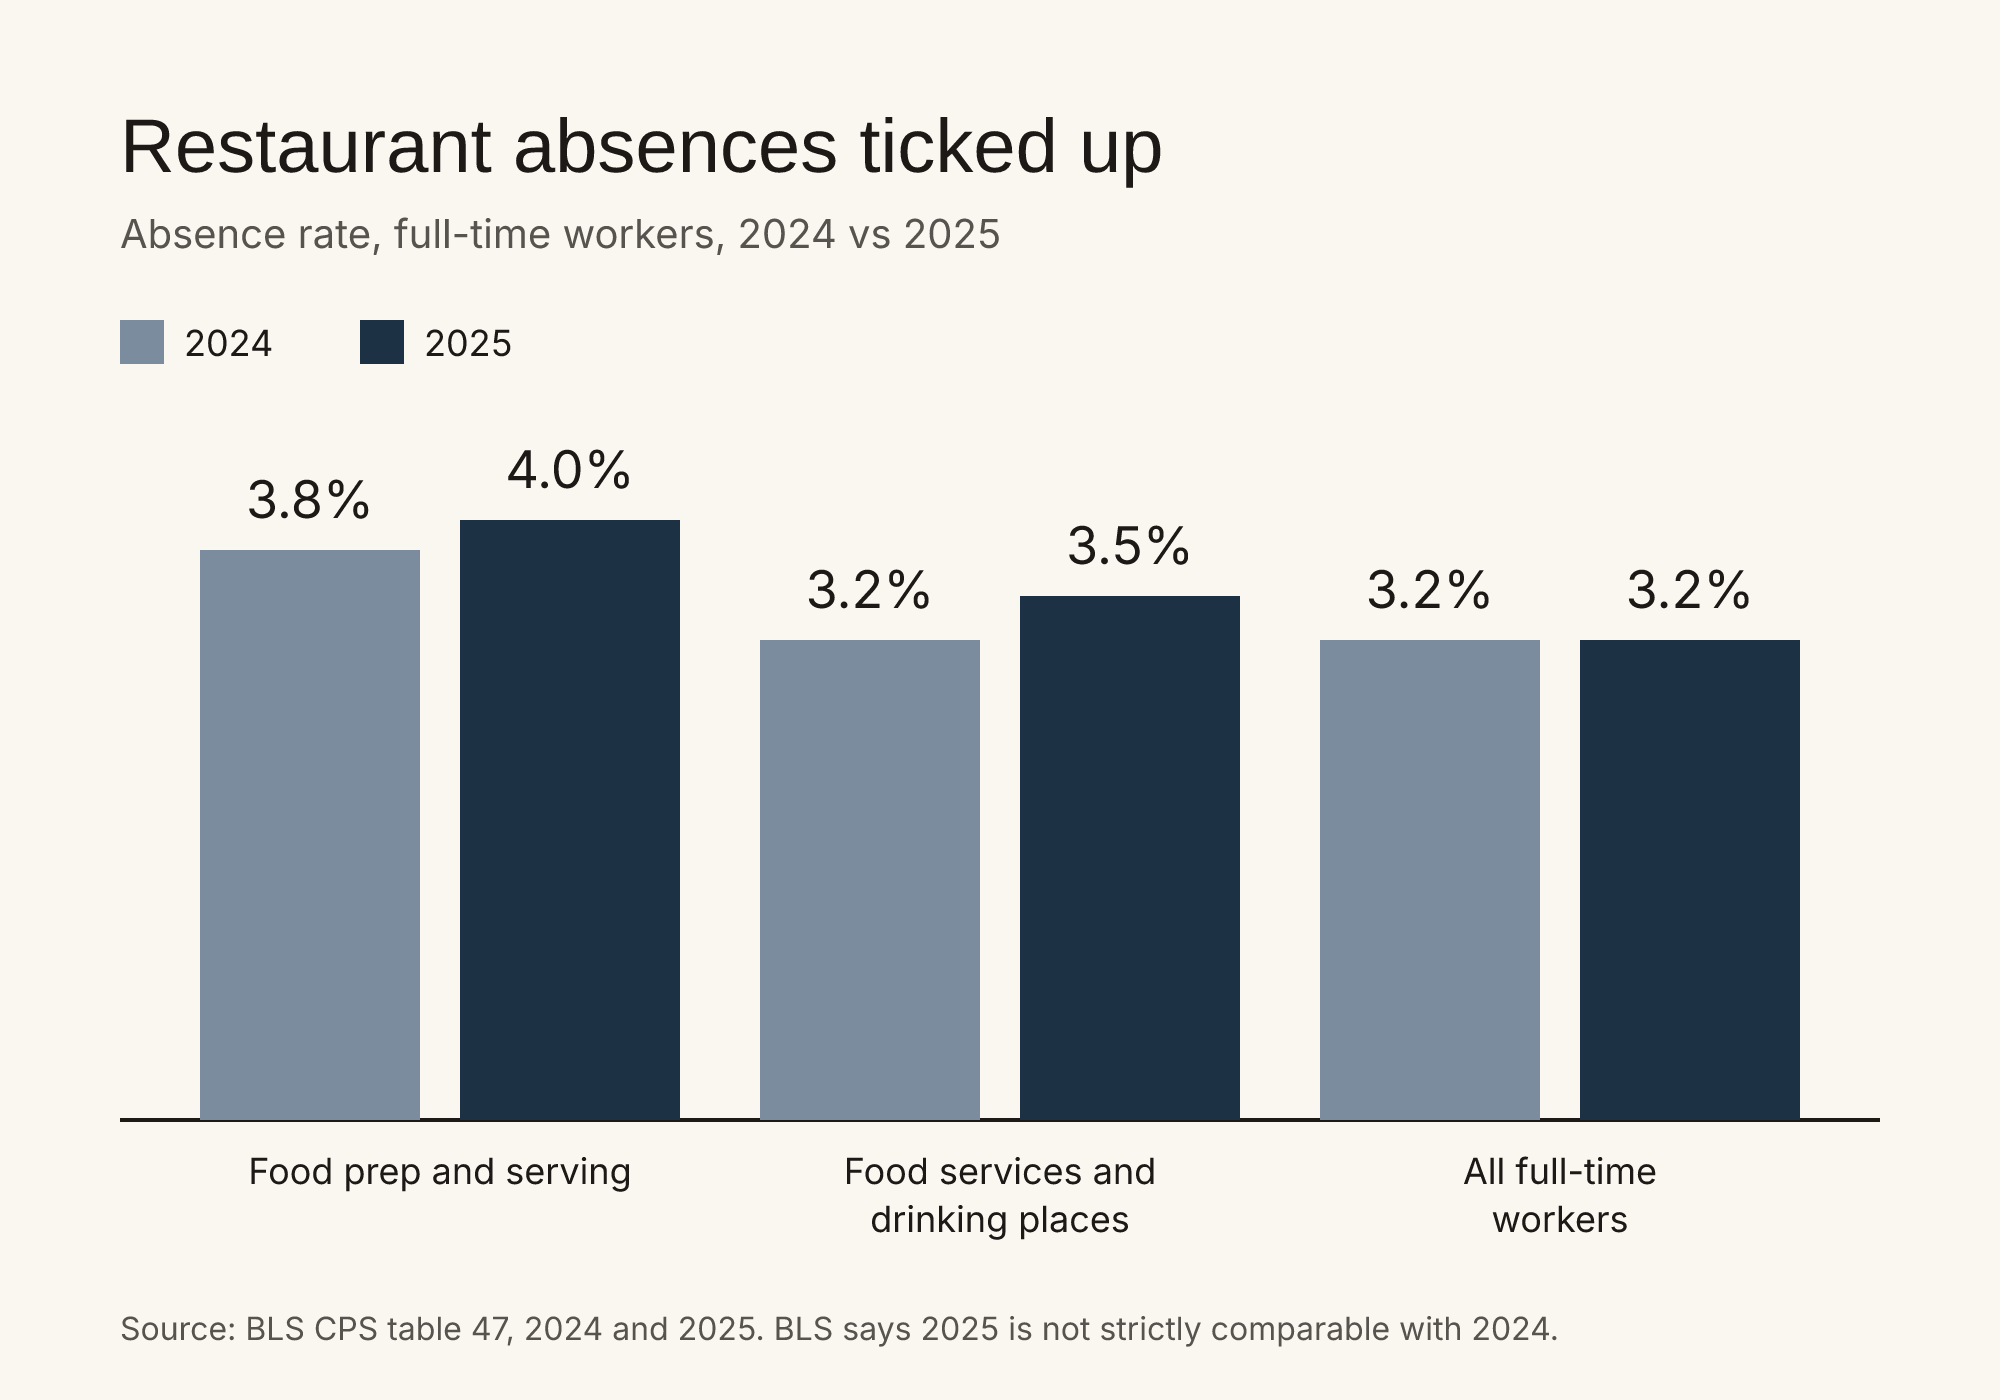
Restaurant absence rates went up while the all-worker rate stayed flat.
- My math: the food prep and serving rate rose 0.2 points in a year (4.0 - 3.8).
- One caution, straight from BLS: the 2025 averages cover 11 months because October 2025 data were not collected, and 2025 uses a newer industry classification. BLS says 2025 is not strictly comparable with earlier years.
So I would not call it a trend yet. I would call it a reason to watch your own numbers instead of waiting for the next table.
When sick workers come in anyway
The opposite of a call-off is the person who should have called off and did not.
- 12% of food workers told CDC's Environmental Health Specialists Network (EHS-Net) they had worked while sick with vomiting or diarrhea. Workers were less likely to do it in restaurants that were less busy, had a policy telling workers to report illness to a manager, had on-call workers who could fill in, or had a more experienced manager (CDC EHS-Net, March 2012).
- Nearly half of restaurant-related outbreaks are caused by sick food workers (CDC).
- Only 29% of restaurants offer paid sick days, and 42% of employees put paid sick days at the top of their wish list, in a 2026 7shifts study of over 1,000 US restaurant workers. Being short-staffed ranked first among employee stressors in the same study (7shifts).
Look at that CDC list again. Two of the four things that kept sick people home are an on-call bench and a clear rule about telling the manager. Both are about having a plan for the call-off before it happens. If your crew thinks calling off leaves everybody stuck, the sick ones come in.
Call-off and scheduling patterns
- In 7shifts data from 150,000+ restaurant pros, Saturday was the most common day of the week for restaurant workers to be no-shows (7shifts, 2017 data).
- The same data showed restaurants published the next schedule an average of 2.44 days in advance (same source).
That data is old, but it matches every schedule I have written. Saturday is your biggest day and the one most likely to come up short. A schedule posted two days out also gives people two days to find a conflict.
For what a single missed shift costs in overtime and lost sales, see what a no-call no-show actually costs your shift. Absences also run ahead of quits, so the numbers in restaurant employee turnover statistics are the next page to read.
What operators can do with these numbers
- Measure your own rate. Each week, count how many people missed all or part of a shift and divide by headcount. Compare it with the 4.0% weekly food prep and serving benchmark.
- Put a dollar figure on it. Use your real overtime rate and what a short shift does to sales in the no-show cost calculator.
- Build the bench before Saturday. Keep one or two people you can call. CDC found on-call workers made it less likely sick workers came in.
- Write down every call-off the minute it happens. Memory is how one person's fourth Saturday call-off looks like their first. Use a call-off log with pattern alerts: log it in 4 taps and get told when someone crosses your threshold. $14/mo, 14-day free trial.
Methodology and sources
Numbers come from the Bureau of Labor Statistics (Current Population Survey table 47, 2024 and 2025 annual averages), the CDC Environmental Health Specialists Network and 7shifts. BLS absence data covers full-time wage and salary workers only. Part-time workers are not counted, so a schedule built on part-timers can look different. BLS 2025 averages exclude October 2025 and use a newer industry classification, so year-to-year changes are approximate. The CDC sick-worker figures come from older studies and are dated where they appear. 7shifts figures are from its own user data and surveys, not audited payroll. I left out sick leave law and attendance policy rules; this page covers the numbers, not compliance. Each number is checked against its source on a regular schedule, and this page is updated when newer data is published.
Frequently asked questions
What is the absenteeism rate for restaurant workers?
BLS puts the 2025 absence rate for full-time workers in food preparation and serving occupations at 4.0%, against 3.2% for all full-time wage and salary workers. In the food services and drinking places industry the rate was 3.5%.
How does restaurant absenteeism compare with other jobs?
Food preparation and serving workers had a 4.0% absence rate in 2025, about 25% higher than the 3.2% all-worker rate. Office and administrative support was 3.9%, health care and social assistance 3.8%, manufacturing 2.9% and management and professional jobs 3.0%.
Why do restaurant employees miss work?
Illness or injury is the main reason. In 2025, 2.8% of full-time food preparation and serving workers were out for illness or injury in an average week and 1.1% for other reasons, so illness is about 70% of the absence rate.
How many restaurant workers come to work sick?
A CDC EHS-Net study found that 12% of food workers said they had worked when they were sick with vomiting or diarrhea. CDC also says nearly half of restaurant-related outbreaks are caused by sick food workers.
Do restaurants offer paid sick days?
In a 2026 7shifts study of over 1,000 US restaurant workers, only 29% of restaurants offered paid sick days, while 42% of employees had paid sick days at the top of their wish list.
How often is this page updated?
The sources behind every number on this page are re-checked on a schedule. When a source publishes newer data, the page is updated and the date at the top changes.