Restaurant Profit Margin Statistics (2026): The Numbers, With Sources
Restaurant profit margin statistics, 2026: pre-tax margins by segment, how many operators lost money, prime cost and menu price data. Every number sourced.
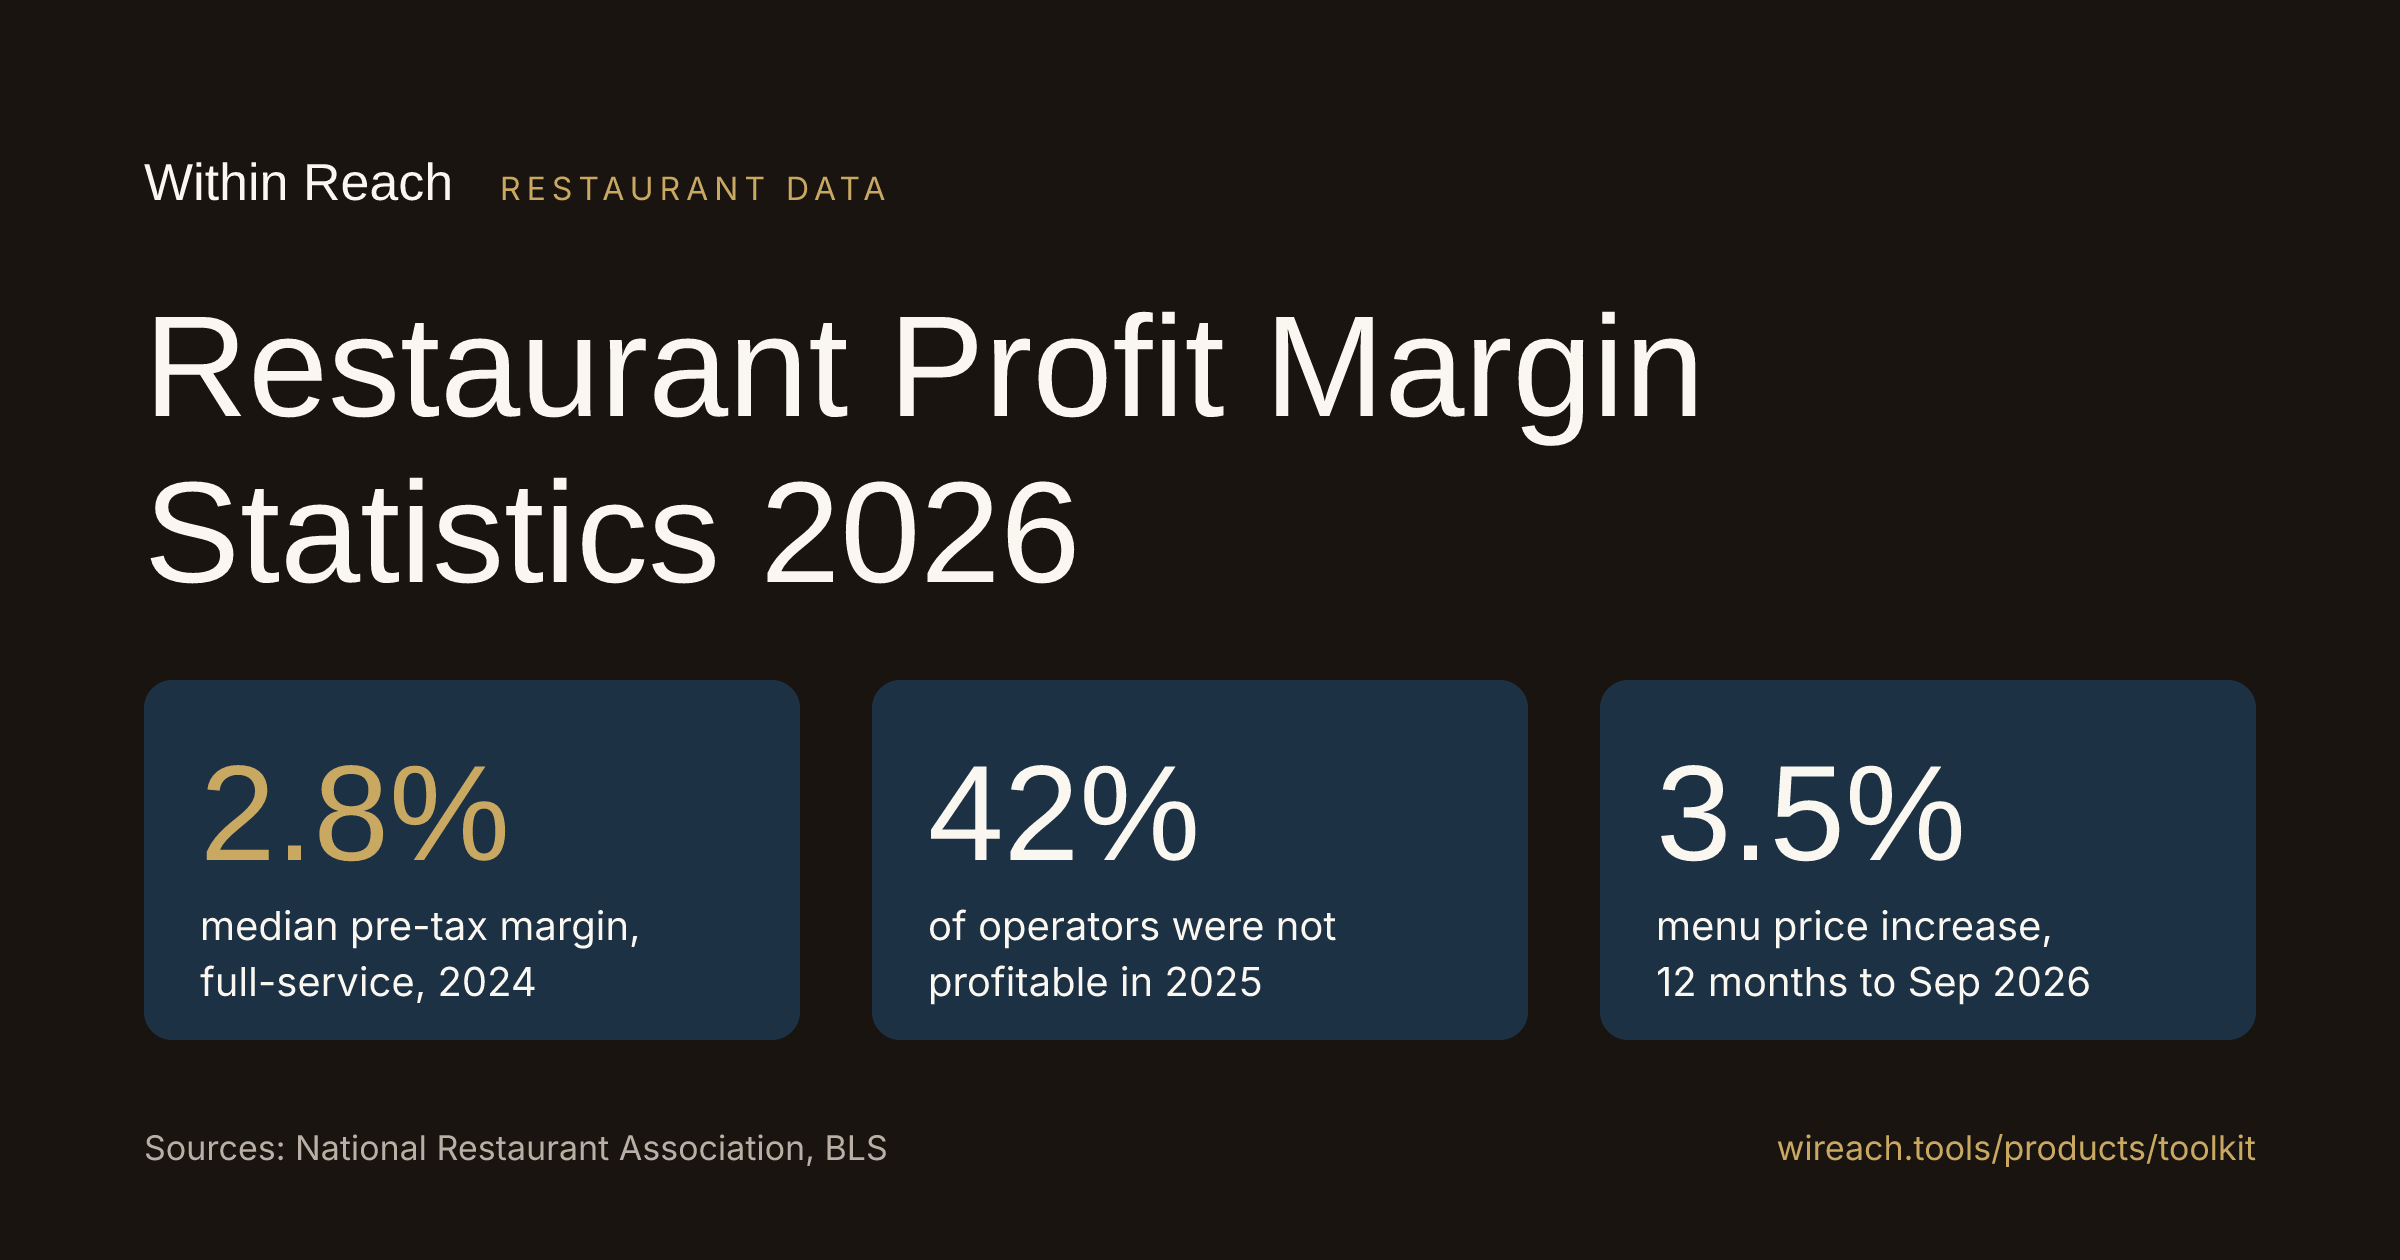
Last updated November 10, 2026. Every number below comes from a linked source, listed with each section.
Most people outside this business think a busy restaurant is a rich restaurant. I have decades of restaurant knowledge, and I can tell you the dining room can be full and the P&L can still be red. The margin is pennies, and it goes out the door in comps, waste, a cooler that dies on a Saturday and labor nobody cut.
This page puts the restaurant profit margin numbers worth knowing in one place: what operators actually keep, how many lost money, where the money goes, and what menu prices are doing. Government data first, then the National Restaurant Association, then public company filings and operator surveys. Where I did the math myself, I say so and show it.
Key restaurant profit margin statistics
- Full-service restaurants keep a median 2.8% of sales as income before taxes. Limited service keeps 4.0% (National Restaurant Association, 2024 data).
- 42% of operators said their restaurant was not profitable in 2025 (National Restaurant Association).
- 33% said they were not profitable in the first half of 2026 (National Restaurant Association).
- Full-service stores doing $2 million or more kept a median 4.3%. Stores under $2 million kept 1.1% (National Restaurant Association, 2024).
- Prime cost, food plus labor, takes a median 65 cents of every sales dollar in limited service (National Restaurant Association).
- Food and labor each take about 33 cents of every sales dollar (National Restaurant Association, July 2026).
- Menu prices rose 3.5% in the 12 months ending September 2026, while grocery prices rose 1.8% (BLS).
- Publicly traded restaurant and dining companies show a 9.37% net margin (NYU Stern, January 2026).
- 52% of operators raised menu prices in the first half of 2026 to offset food costs, down from 66% at the start of the year (Restaurant365).
A 2.8% margin does not leave room for the small stuff. A walk-in that runs warm overnight, a fryer repair that waits a week, a cash drawer nobody audits. That is where profit leaks on a shift, not on the spreadsheet. LP audits, R&M tickets and shift handoff notes in one place is what the Audits & Repairs app for LP audits and R&M tickets is built for.
What restaurants actually keep
The National Restaurant Association's Restaurant Operations Data Abstract is built on surveys of more than 900 restaurants. It is the best regular read on what a normal store keeps, not a public chain.
| 2024, median share of sales | Full service | Limited service |
|---|---|---|
| Income before taxes | 2.8% | 4.0% |
| Payroll and benefits | 36.5% | |
| Prime cost (food, beverage and labor) | 65 cents per dollar |
Sources: National Restaurant Association, August 2025, press release
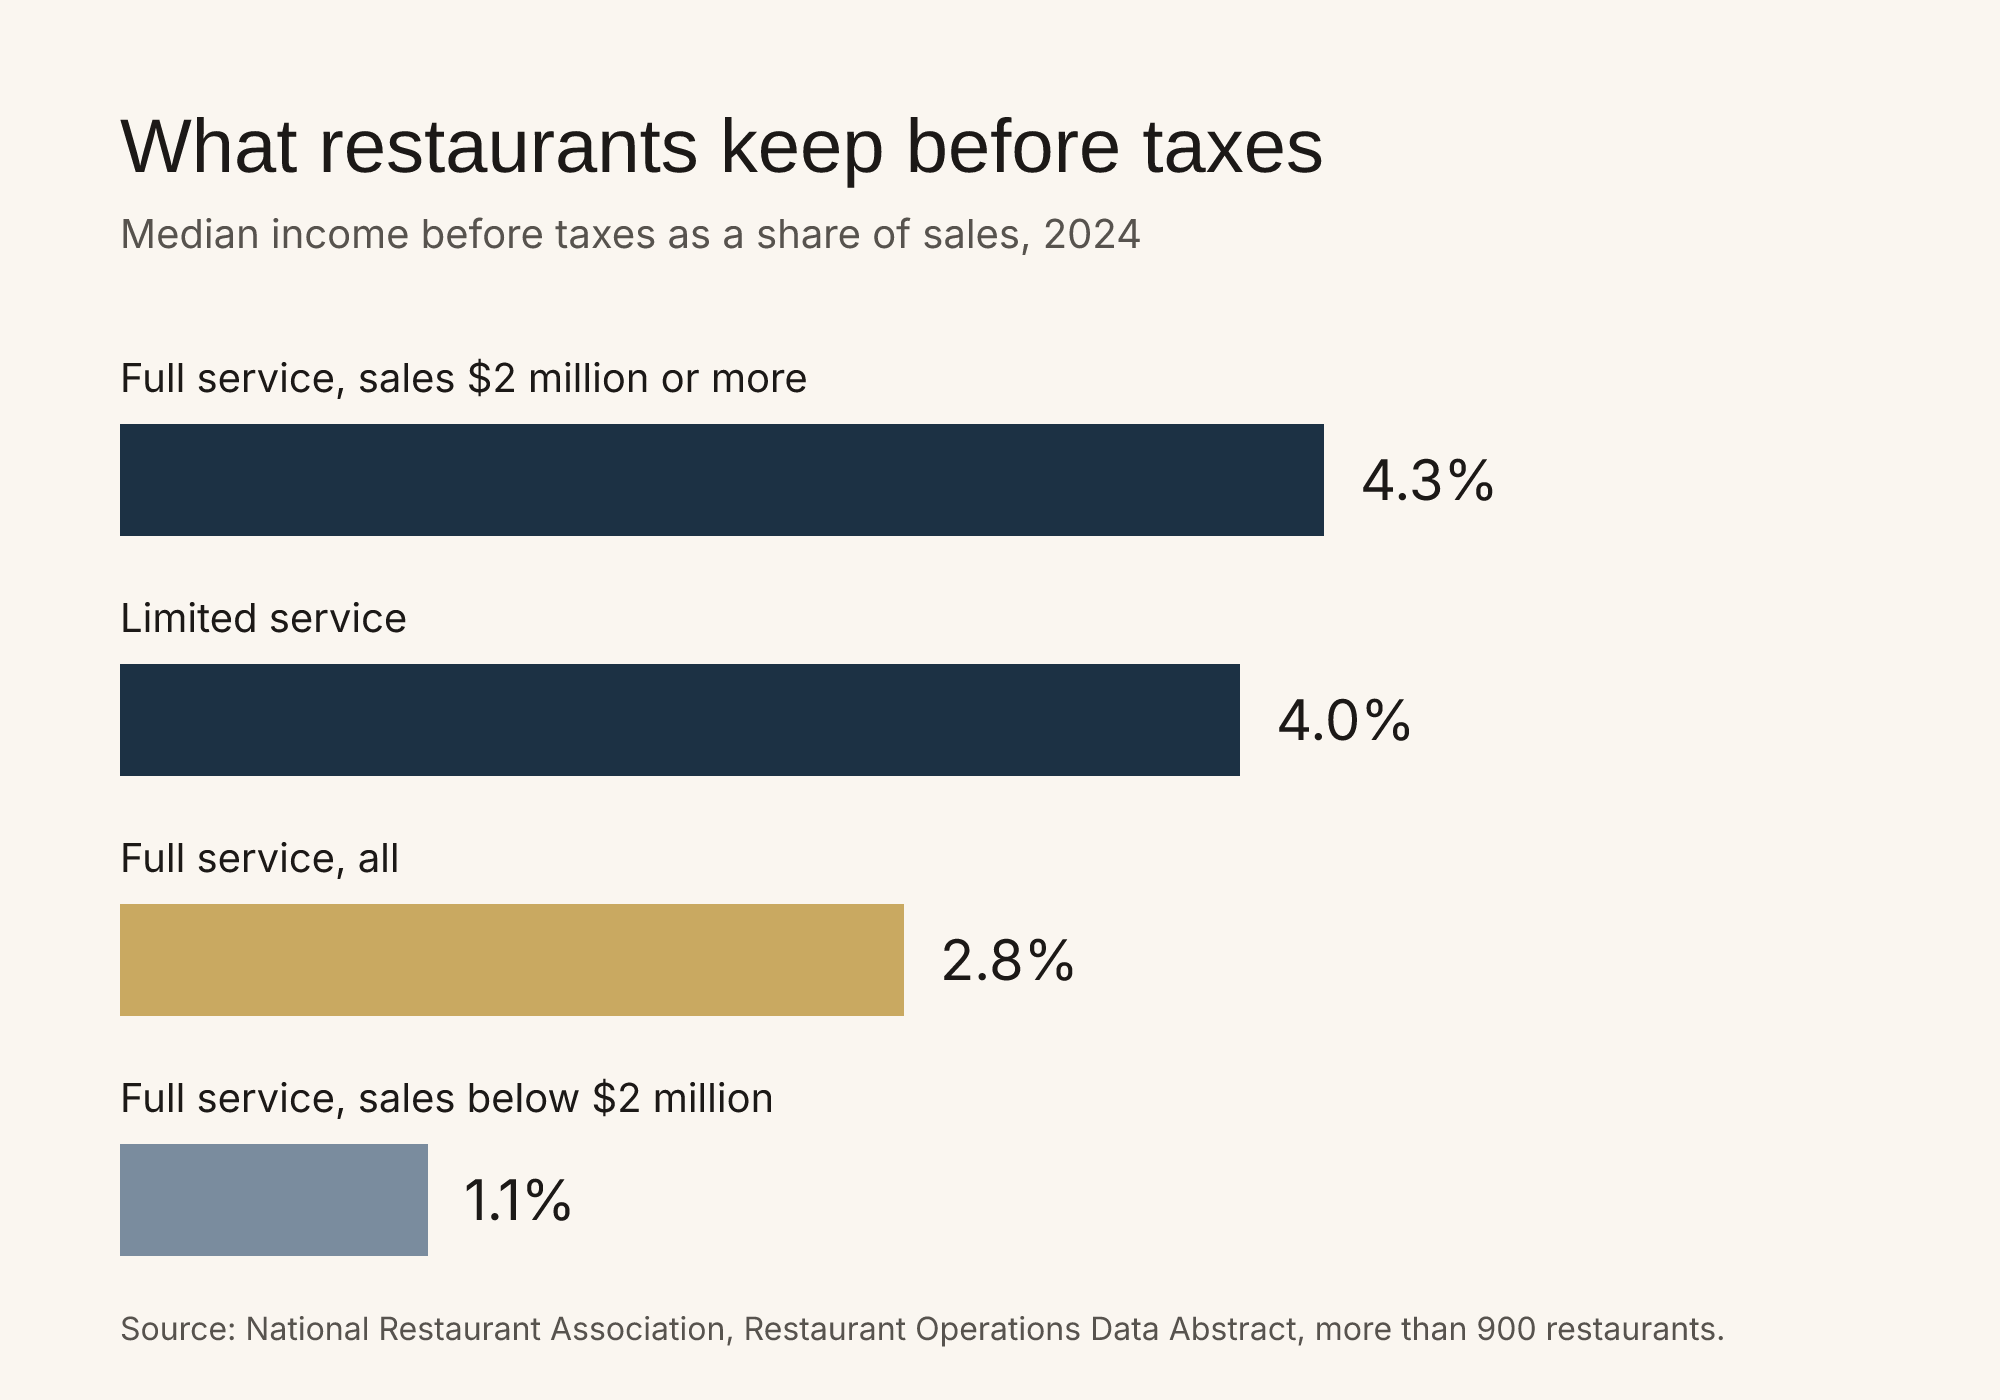
What a restaurant keeps before taxes, by segment and size. Medians from more than 900 restaurants.
What that looks like for one store (my math): a full-service store doing $1,000,000 in sales at the 2.8% median keeps about $28,000 before taxes (1,000,000 x 0.028). One point of sales on that store is $10,000, more than a third of the whole year's profit (10,000 / 28,000 = 0.357).
Put payroll next to profit and it gets real. Full-service payroll and benefits run 36.5% of sales. That is about 13 times the pre-tax margin (36.5 / 2.8 = 13.04). Let labor drift one point and a third of the year's profit walks out with it. The labor side of this is broken down in restaurant labor cost statistics, and you can check your own week in the labor cost calculator.
How many restaurants are losing money
- 42% of operators said their restaurants were not profitable in 2025, and that they had limited ability to raise menu prices. 60% reported decreased traffic in 2025 (National Restaurant Association, February 2026).
- That number improved in 2026. 33% said their restaurant was not profitable during the first half of 2026 (National Restaurant Association, July 2026).
- For the second half of 2026, 26% of operators expect conditions to improve, 17% expect them to get worse and 57% expect about the same (same source).
- In the Toast 2026 survey of 676 operators with 16 or fewer locations, improving profitability was the number 1 goal, ranked in the top 3 by 37% (Toast, August 2026).
One in three is still a lot of stores working for nothing. Not profitable does not always mean a bad operator. Sometimes it is a lease signed in a different year. But a lot of the time it is the same 2 or 3 points leaking every week where nobody is looking.
Why bigger stores keep more
The Association split its 2024 full-service data by sales volume. The gap is the whole story of fixed costs.
| Full service, 2024 medians | Sales $2 million or more | Sales below $2 million |
|---|---|---|
| Income before taxes | 4.3% | 1.1% |
| Food and non-alcohol beverage cost | 31.0% | 33.7% |
Source: National Restaurant Association, October 2025
My math: the bigger stores kept 3.2 points more of every sales dollar (4.3 - 1.1 = 3.2).
Rent, the manager's salary and the insurance bill do not shrink on a slow week. More sales spread them thinner. A smaller store has to win on food cost and labor because it cannot win on volume. If you want to see where your store sits, the break-even covers walkthrough shows how many guests it takes to cover the fixed bills.
Where the sales dollar goes: public chains
Public companies report their store-level numbers every quarter. These are large chains with buying power, so their margins are not a target for an independent. They do show where the dollar goes.
| Q3 2026 | Store-level margin | Food cost | Labor |
|---|---|---|---|
| Chipotle | 23.3% (24.5% a year earlier) | 29.5% | 25.7% |
| Shake Shack | 22.5% (22.8% a year earlier) | 28.3% | 25.4% |
| Texas Roadhouse | 14.6% (14.3% a year earlier) | 35.5% | 33.7% |
Sources: Chipotle Q3 2026 release, Shake Shack Q3 2026 release, Texas Roadhouse Q3 2026 release
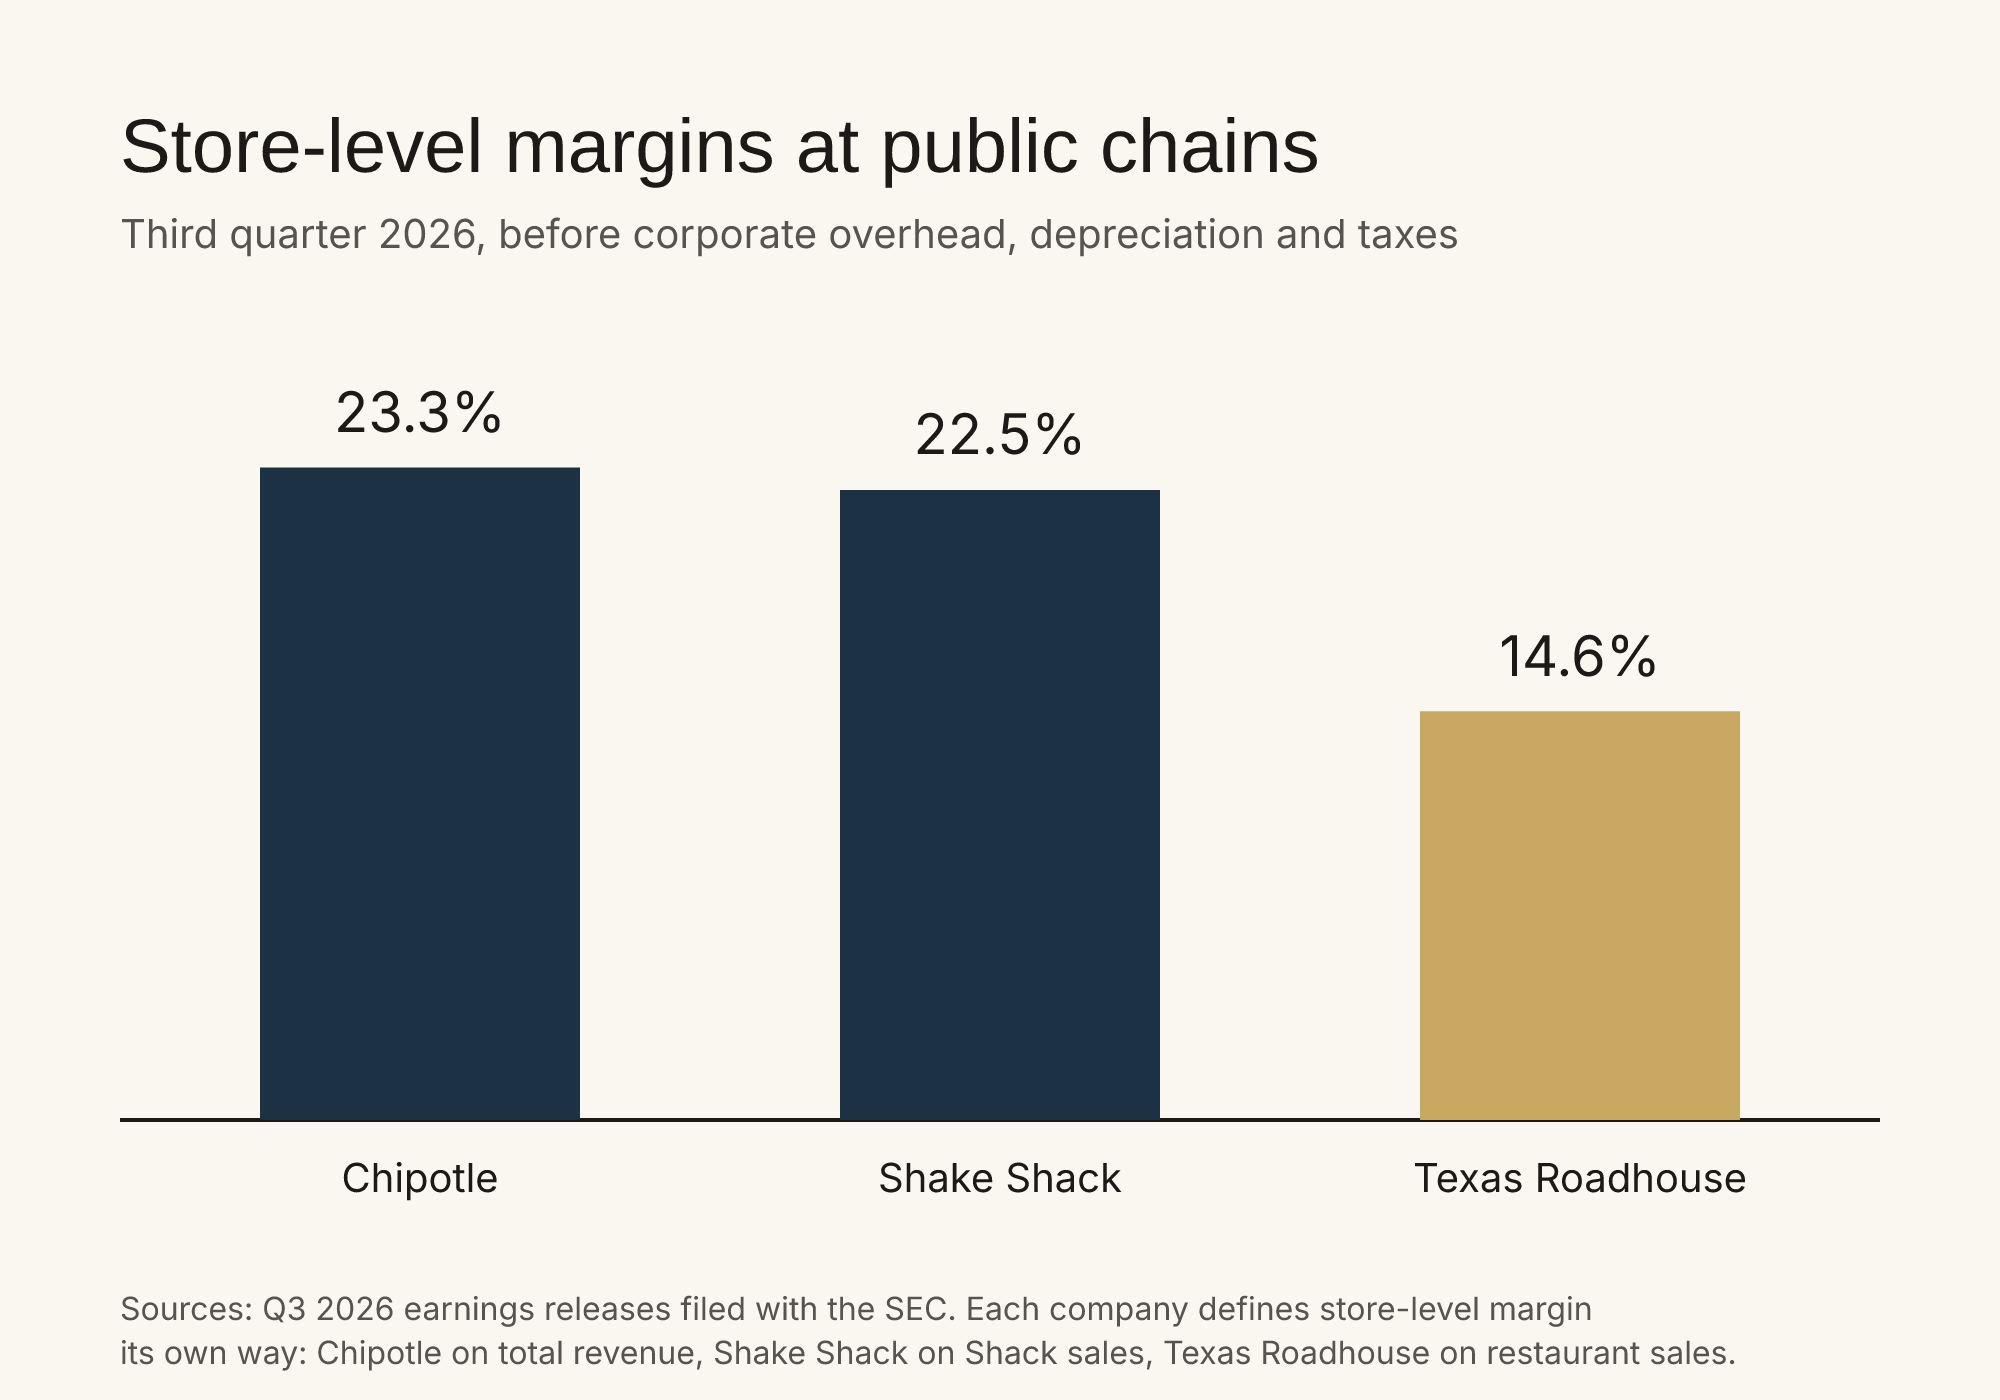
Store-level margin is before corporate overhead, depreciation and taxes. Each company defines it a little differently.
- Chipotle labor went from 25.2% to 25.7% of revenue, and that is a big part of why its margin slipped.
- Store-level margin is not profit. It is before corporate overhead, depreciation and taxes. Each company uses its own definition.
- Across 64 publicly traded US restaurant and dining companies, the net margin is 9.37% and the pre-tax operating margin is 13.79%, against a 9.74% net margin for the total market (NYU Stern, Damodaran, January 2026).
Texas Roadhouse runs food and labor at a combined 69.2 points and still clears 14.6. That tells you how much the other lines matter. Prime cost is the number to watch, and the actions below show how to track yours.
Menu prices and costs in 2026
The BLS Consumer Price Index tracks what guests pay. USDA uses it to forecast the year.
| 12 months ending Sep 2026 | Price change |
|---|---|
| Full service meals and snacks | 3.8% |
| Food away from home | 3.5% |
| Limited service meals and snacks | 3.2% |
| Food at home (grocery) | 1.8% |
| All items | 3.7% |
Source: BLS Consumer Price Index, September 2026
- My math: menu prices rose 1.7 points faster than grocery prices (3.5 - 1.8 = 1.7). That gap is what pushes a guest to eat at home.
- USDA forecasts food-away-from-home prices up 3.5% for 2026 (forecast interval 3.4% to 3.7%) and food-at-home prices up 2.3%. Over 2006 to 2025, restaurant prices rose an average 3.5% a year (USDA ERS, October 2026).
- Restaurant average hourly earnings are up 41% since February 2020, while wholesale food prices are up 35% (National Restaurant Association).
- 87% of operators said food costs went up in the first half of 2026, and 52% raised menu prices to offset it (Restaurant365, survey of more than 420 operators representing nearly 10,000 locations).
- 43% of operators say they will raise menu prices if the cost of goods rises, down 5 points from a year earlier (Toast).
- The Association expects industry sales to grow 4.3% in 2026, down from the 4.8% it projected at the start of the year. Real growth after inflation is projected at 0.8%, down from 1.3% (National Restaurant Association, July 2026). Its February outlook put 2026 sales at $1.55 trillion (National Restaurant Association).
Fewer operators are raising prices because guests are pushing back. When the price lever is used up, margin has to come from inside the four walls. The food side is broken down in restaurant food cost statistics.
What operators can do with these numbers
- Know your real margin. Pre-tax income divided by sales for the last 12 months. Compare it with 2.8% for full service and 4.0% for limited service.
- Price a point. Take 1% of your annual sales. That is what one point of food or labor costs you. On $1,000,000 it is $10,000.
- Watch prime cost weekly. Food plus labor. The 65 cents benchmark is limited service; full service runs higher on labor. Put this week's food and labor into the WRI prime cost calculator every week, not once a quarter.
- Close the small leaks. Shrink, comps nobody wrote down, a repair that waited too long. Walk the store with a loss prevention audit and log every broken piece of equipment the day it breaks. That is what the LP audits, R&M tickets and handoff notes in Audits & Repairs keep on one phone app, so the next manager walks in knowing what you found.
Methodology and sources
Numbers come from the Bureau of Labor Statistics (Consumer Price Index), USDA Economic Research Service, the National Restaurant Association (Restaurant Operations Data Abstract, State of the Restaurant Industry and its economic commentary), quarterly earnings releases filed with the SEC by Chipotle, Shake Shack and Texas Roadhouse, NYU Stern (Damodaran), Restaurant365 and Toast. The Association's margin figures are medians from participating restaurants for 2024. Public company margins use each company's own definition and denominator, and they are large chains, so they are not a benchmark for a single independent store. Survey figures are what operators reported, not audited financials. I left out tax law, wage law and tip rules; this page covers margins, not compliance. Each number is checked against its source on a regular schedule, and this page is updated when newer data is published.
Frequently asked questions
What is the average profit margin for a restaurant?
The National Restaurant Association's Restaurant Operations Data Abstract, built on surveys of more than 900 restaurants, puts median income before taxes at 2.8% of sales for full-service restaurants and 4.0% for limited-service restaurants in 2024. On $1,000,000 in full-service sales, 2.8% is about $28,000 before taxes.
How many restaurants are not profitable?
In the National Restaurant Association's 2026 State of the Restaurant Industry report, 42% of operators said their restaurants were not profitable in 2025. In the Association's July 2026 update, 33% said their restaurant was not profitable during the first half of 2026.
Do bigger restaurants have better profit margins?
Yes, in the National Restaurant Association's 2024 data. Full-service restaurants with sales of $2 million or more had a median income before taxes of 4.3% of sales. Full-service restaurants with sales below $2 million had a median of 1.1%. Their food and non-alcohol beverage costs were also higher, a median 33.7% of sales against 31.0%.
What profit margins do public restaurant companies report?
In the third quarter of 2026, Chipotle reported a restaurant level operating margin of 23.3%, Shake Shack reported restaurant-level profit of 22.5% of Shack sales, and Texas Roadhouse reported a restaurant margin of 14.6%. NYU Stern's January 2026 data shows a 9.37% net margin across 64 publicly traded US restaurant and dining companies. Those are large chains and are not comparable to a single independent store.
How much are restaurant menu prices going up?
BLS data shows food away from home prices up 3.5% in the 12 months ending September 2026, with full service meals up 3.8% and limited service meals up 3.2%. Food at home rose 1.8%. USDA forecasts food-away-from-home prices will rise 3.5% for all of 2026.
How often is this page updated?
The sources behind every number on this page are re-checked on a schedule. When a source publishes newer data, the page is updated and the date at the top changes.